nRF Connect for VSCode unlimited number of issues

Hi, I have several issues just to start off with. One is when I generate support information, it does its thing, and then stops, and I have no idea where the support information was put. Based on instructions to another customer, that is not supposed to happen. It did not happen for them apparently, but it happened to me.

The next problem is when I start VS Code from the toolchain manager on Linux, v2.0.0, west is not found.

The next problem is when I start VS Code from the command line on Linux, cmake  --version gives an error in VS Code, although it is perfectly fine on the command line.

Basically I can do almost anything in a Linux terminal with regards to building and debugging nRF9160 projects, but on Linux I cannot build or debug, and on Windows I can build but not debug, when VS Code is involved.

I have never ever seen an IDE in many, many years that is quite so indecipherable. This is really crazy. Perhaps you can fix that or switch to another recommended IDE?

Thanks.

Burt

Parents
  • Hello Burt,

    I really have trouble with reproducing anything. It feels like there's is something else that may have gotten wrong with the installation or configuration and now we are trying to repair the symptoms without touching on the underlying issue.

    I would also appreciate getting screenshots of any issues you are facing, since it is very hard to follow on the descriptions when I cannot reproduce most of the issues you are facing. It also makes it much easier to possibly escalate it and/or ask for a second opinion.

    Best regards,

    Michal

  • Okay, here are steps. Start with everything clean, but make one change to ncs/v2.1.0/zephyr/cmake/compiler/gcc/compiler_flags.cmake: remove the -Wno-pointer-sign flag from line 37.

    Also, this all must be done on Windows: Linux and Mac do not have the problem.

    Do nRF Connect for VS Code quick setup with 2.1.0 SDK and 2.1.0 toolchain.

    Then Add an Existing Application, it should be .../nrf/applications/asset_tracker_v2.

    Now Add Build Configuration, accept all defaults, and click Build Configuration.

    After the build completes, on the left under ASSET_TRACKER_V2 open up Source files>Application>modules>cloud_module.c so cloud_module.c shows in an editor window.

    You should see yellow markers on the right-side indicating warnings. In fact, if you mouse hover over the window title, cloud_module.c 9+, you will see that there are 20 problems in the file. For example, on line 278, you will see a yellow squiggle underneath "buf" and a message indicating a -Wpointer-sign warning when you hover over the squiggle. (The warning is due to having -Wall set.)

    Now open a Git Bash terminal in VS Code and issue the command

    $ touch src/modules/cloud_module.c

    Now on the left, under ACTIONS, click Build.

    Okay, this did not cause the problem I was looking for--I thought the yellow squiggles might disappear, so we will go one step more sophisticated: modify that line 278 to use a (const char*) cast before buf so the line reads

    err = nrf_cloud_agps_process((const char*)buf, len);

    and save the file. This should make that one warning go away, because if you mouse hover over the function call nrf_cloud_agps_process on that line, you will see it is looking for the first argument to be of type "const char*".

    So once again, perform the Build action (not pristine, that would take forever). The warning does not go away. That is a very, very bad thing.

    I wanted to double check that Linux does not show this problem, but some other problem occurred there so I will just say that Linux and Mac in general seem to work more reliably than Windows. If you can replicate my results on Windows, you may want to see whether Linux behaves differently. I will try that again later, but for now I suggest we focus on Windows.

    Let me know if you need more information. Thanks for sticking with this, Michal. Oh,yeah, there are some other problems with "Run Code Analysis on Active File" but let's look at one problem at a time. Do not select that function for/during this test procedure. It uses a different mechanism of analyzing the file.

    Burt

  • Great, thank you, Michal. Just to be accurate, the warning count for me showed as 9+, but hovering shows that 9+ means 20 (rather than 20+).

    Burt

  • Now open a Git Bash terminal in VS Code and issue the command

    $ touch src/modules/cloud_module.c

    Now on the left, under ACTIONS, click Build.

    Okay, this did not cause the problem I was looking for--I thought the yellow squiggles might disappear

    For me that actually did make all the warnings disappear on Windows 10.

    I have followed through with the rest of your instructions, but that did not make any warnings reappear.

    Okay, here are steps. Start with everything clean, but make one change to ncs/v2.1.0/zephyr/cmake/compiler/gcc/compiler_flags.cmake: remove the -Wno-pointer-sign flag from line 37.

    I have just commented out that line, is that how you wanted me to do it?

    I have also tried to introduce some new warnings and even though they appear in the compiler output, they don't appear in the editor.

    Thank you for being patient with the explanations, I am going to report the issue with missing/dissapearing warnings to the nRF Connect for VS Code team with your steps to reproduce it.

    Best regards,

    Michal

  • Hi Michal, you did the correct thing for line 37, actually smarter than what I had done, which was to simply remove the characters "-Wno-pointer-sign". But with what I had done, it leaves a meaningless line, although it did the job.

    By the way, at this moment in time, that line 278 warning, where I fixed the code like I mentioned above to make the warning go away, the warning HAS disappeared. What did I do--I don't think I have done anything but put the computer in standby and waited a day or two, maybe run other programs, but I cannot swear to not having touched my VS Code at all, although I am pretty certain that is the case. I just now tried to recreate that, but I cannot. One thing I did not do in the last 2 days is to reload the window using Ctrl-Shift-P Developer:Reload Window, because that causes all the warnings to disappear (another problem). And my past experience is that not even a pristine build will make the warnings reappear--instead, I probably have to re-edit the build configuration, where I make no changes but click the Build Configuration button. Yes, I just verified that that is what I have to do to make the editor show the warnings again. Call it a super-pristine build. Regardless, that is way too slow to be practical. See if you get the same results, and you may want to report it to the team. Finally, I am glad you noticed the warnings show in the compiler output--this gets to the heart of the issue--the warnings are not transferred to the editor window.

    Burt

  • Hello Burt,

    I got pointed to this release note that links here.

    You may want to take a look at it and see if it helps with anything.

    Best regards,

    Michal

  • Hi Michal,

    Yes, that is very helpful. And it brings us to the next problem--what really needs focus. This problem is the one that happens to me on Windows and NOT Linux or Mac. All you have to do to try to replicate it is to open cloud_module.c in an editor window, right click in the window and choose Run Code Analysis on Active File. Instead of seeing the warnings we want, you should expect to see a red carat at the very start of the file, and if you hover, you should see a window that starts off with

    I probably will get messed up if I try typing below what I pasted so I'll type here instead. I think it is the first error, the redefinition with different types, that screws up everything, but that's a question for the experts. I do not know where "unsigned long long" is coming from--it is probably something internal to the C/C++ extension. Anyway, like I said above, the interesting warnings are blocked and all I see is this set of Errors (that show as one clang-diagnostic-error). Thanks Michal, Burt.

    Error while processingC/C++(clang-diagnostic-error)

    stddef.h(209, 23): typedef redefinition with different types ('unsigned int' vs 'unsigned long long')
    cmsis_compiler.h(278, 4): Unknown compiler.
    mpu_armv8.h(130, 1): unknown type name '__STATIC_INLINE'
    mpu_armv8.h(143, 1): unknown type name '__STATIC_INLINE'
    mpu_armv8.h(188, 1): unknown type name '__STATIC_INLINE'
    mpu_armv8.h(205, 1): unknown type name '__STATIC_INLINE'
    mpu_armv8.h(225, 1): unknown type name '__STATIC_INLINE'
    mpu_armv8.h(234, 1): unknown type name '__STATIC_INLINE'
Reply
  • Hi Michal,

    Yes, that is very helpful. And it brings us to the next problem--what really needs focus. This problem is the one that happens to me on Windows and NOT Linux or Mac. All you have to do to try to replicate it is to open cloud_module.c in an editor window, right click in the window and choose Run Code Analysis on Active File. Instead of seeing the warnings we want, you should expect to see a red carat at the very start of the file, and if you hover, you should see a window that starts off with

    I probably will get messed up if I try typing below what I pasted so I'll type here instead. I think it is the first error, the redefinition with different types, that screws up everything, but that's a question for the experts. I do not know where "unsigned long long" is coming from--it is probably something internal to the C/C++ extension. Anyway, like I said above, the interesting warnings are blocked and all I see is this set of Errors (that show as one clang-diagnostic-error). Thanks Michal, Burt.

    Error while processingC/C++(clang-diagnostic-error)

    stddef.h(209, 23): typedef redefinition with different types ('unsigned int' vs 'unsigned long long')
    cmsis_compiler.h(278, 4): Unknown compiler.
    mpu_armv8.h(130, 1): unknown type name '__STATIC_INLINE'
    mpu_armv8.h(143, 1): unknown type name '__STATIC_INLINE'
    mpu_armv8.h(188, 1): unknown type name '__STATIC_INLINE'
    mpu_armv8.h(205, 1): unknown type name '__STATIC_INLINE'
    mpu_armv8.h(225, 1): unknown type name '__STATIC_INLINE'
    mpu_armv8.h(234, 1): unknown type name '__STATIC_INLINE'
Children
  • Hello Burt,

    Sorry for the late answer, I am going to check it on Windows tomorrow. Thank you for all the feedback.

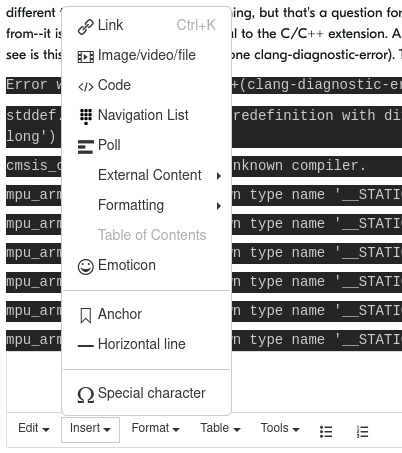
    By the way, a small tip for the future: for inserting code/log snippets I would recommend clicking insert->Code in the text editor. Makes things easier to read and follow.
    Like in this screenshot:

    Best regards,

    Michal

  • Thanks, Michal, looking forward to your findings and help. By the way, you pointed me earlier to a release note. This is just an aside, but a couple of things in it, in this sentence from that release note:

    We have disabled the build system problem-matcher for C code, as it duplicates the IntelliSense errors, but does not update the errors as you edit. 

    did not seem to be 100% accurate. The IntelliSense errors--they are really Code Analysis errors, correct? And by default, Code Analysis only runs when you right click and command it to run. It's no problem to change the default--in which case the errors are updated each time you save the file. It would be nice to know if the person who wrote that line was thinking of some type of error that I am not thinking of or is it simply a misstatement. I think that the IntelliSense in Microsoft Visual Studio has more features than that in VS Code--perhaps some error detection.

    Thanks, Michal.

    Burt

  • Hi Michal,

    Where did you go--I was hoping to hear your results on Windows. I am wondering if you had to order a Windows computer from the manufacturer and then there were supply chain issues!Rolling eyes Seriously, I hope you were able to reproduce the problem.

    Burt

  • Sorry, I was checking this out a bit, but weren't sure about a few things and forgot to post a reply.

    I think that intellisense has been merged with code analysis, but it feels like for me that they work in a bit different way still? A bit hard to find the exact information around that. But maybe that is because of those errors blocking warnings, as you said.

    I did also get the red carat and similar kind of errors when using the code analysis.

    I will get into dialogue with the developers again about that issue.

    Best regards,

    Michal

  • Thanks, Michal. Both Intellisense and code analysis Clang-tidy exist in the C++ extension, and I don't think they are merged other than in the sense that they both are part of the C++ extension. Visual Studio Code C++ December 2021 Update: clang-tidy - C++ Team Blog (microsoft.com)

    I am happy that you were able to reproduce my issue using code analysis and thank you for discussing it with the developers.

    Burt

Related