Logging thread stack overflow

Hello,

I am having an issue with Zephyr, it constantly reboots the system because of stack overflow.

00> [00:05:36.447,265] <err> os: r0/a1:  0x00000002  r1/a2:  0x20004d60  r2/a3:  0xf0f0f0f0
00> [00:05:36.447,296] <err> os: r3/a4:  0x2000e700 r12/ip:  0x2000a5e4 r14/lr:  0x00058045[0m
00> [00:05:36.447,326] <err> os:  xpsr:  0x41070000
00> [00:05:36.447,326] <err> os: r4/v1:  0x00000000  r5/v2:  0xffffffff  r6/v3:  0xffffffff
00> [00:05:36.447,357] <err> os: r7/v4:  0x00000000  r8/v5:  0x00000001  r9/v6:  0x00000000
00> [00:05:36.447,357] <err> os: r10/v7: 0x00000001  r11/v8: 0x20001a00    psp:  0x20026d28
00> [00:05:36.447,357] <err> os: EXC_RETURN: 0x0
00> [00:05:36.447,387] <err> os: Faulting instruction address (r15/pc): 0x00046704
00> [00:05:36.447,418] <err> os: >>> ZEPHYR FATAL ERROR 2: Stack overflow on CPU 0
00> [00:05:36.447,418] <err> os: Current thread: 0x20004d60 (logging)
00> [00:05:36.780,670] <err> fatal_error: Resetting system

....

[03:04:16.903,503] <err> os: r0/a1:  0x00000002  r1/a2:  0xe000ed04  r2/a3:  0xf0f0f0f0
00> [03:04:16.903,533] <err> os: r3/a4:  0x2000e700 r12/ip:  0x00000000 r14/lr:  0x0003235d
00> [03:04:16.903,533] <err> os:  xpsr:  0x410f0021
00> [03:04:16.903,564] <err> os: r4/v1:  0x20003890  r5/v2:  0x0005a3a3  r6/v3:  0x00000007
00> [03:04:16.903,564] <err> os: r7/v4:  0x000000c6  r8/v5:  0x20003888  r9/v6:  0x00030f79
00> [03:04:16.903,594] <err> os: r10/v7: 0x00058b54  r11/v8: 0x00000000    psp:  0x20026c10
00> [03:04:16.903,594] <err> os: EXC_RETURN: 0x0
00> [03:04:16.903,594] <err> os: Faulting instruction address (r15/pc): 0x00046704
00> [03:04:16.903,625] <err> os: >>> ZEPHYR FATAL ERROR 2: Stack overflow on CPU 0
00> [03:04:16.903,656] <err> os: Fault during interrupt handling
00> 
00> [03:04:16.903,656] <err> os: Current thread: 0x20004d60 (logging)
00> [03:04:17.257,568] <err> fatal_error: Resetting system[0m

Sometimes in these faults, it says "Fault during interrupt handling".

The code line for the faulting address is:

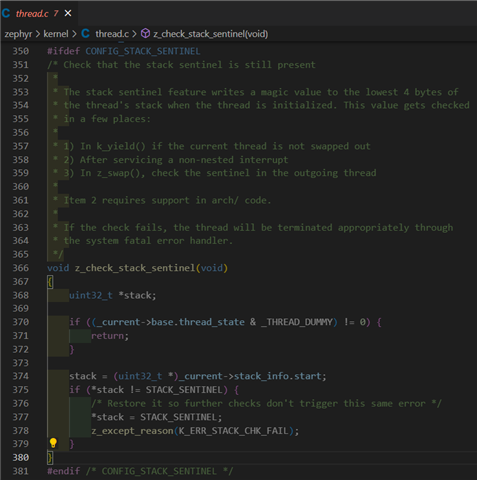
arm-none-eabi-addr2line.exe -e build\zephyr\zephyr.elf 0x00046704
ncs/v2.1.0/zephyr/kernel/thread.c:380

It is actually in reference to the SENTINEL mechanism:

I am using the following CONFIG options for logging, and even with absurd values of stack it still fails:

# -- Lora
# -- BLE
# -- MCUBoot
...

# -- Logs

CONFIG_UART_CONSOLE=n
CONFIG_USE_SEGGER_RTT=y
CONFIG_RTT_CONSOLE=y
CONFIG_LOG_BACKEND_RTT=y

CONFIG_LOG=y
CONFIG_LOG_PROCESS_THREAD=y
CONFIG_LOG_DEFAULT_LEVEL=4
CONFIG_LOG_BUFFER_SIZE=8192

CONFIG_PRINTK=n
CONFIG_LOG_PRINTK=n
CONFIG_NEWLIB_LIBC=y
CONFIG_CBPRINTF_FULL_INTEGRAL=y
CONFIG_CBPRINTF_FP_SUPPORT=y
CONFIG_NEWLIB_LIBC_FLOAT_SCANF=y
CONFIG_NEWLIB_LIBC_FLOAT_PRINTF=y
CONFIG_NEWLIB_LIBC_NANO=n

# -- Optimizations
CONFIG_NO_OPTIMIZATIONS=n

# -- Sentinel and stacks
CONFIG_STACK_SENTINEL=y

CONFIG_THREAD_STACK_INFO=y
CONFIG_THREAD_MONITOR=y
CONFIG_INIT_STACKS=y
CONFIG_THREAD_NAME=y
CONFIG_EXTRA_EXCEPTION_INFO=y
CONFIG_GPIO_LOG_LEVEL_DBG=y
CONFIG_LORA_LOG_LEVEL_DBG=y

CONFIG_BT_RX_STACK_SIZE=4096
CONFIG_IDLE_STACK_SIZE=4096
CONFIG_PRIVILEGED_STACK_SIZE=4096
CONFIG_BT_CTLR_RX_PRIO_STACK_SIZE=1024
CONFIG_BT_HCI_TX_STACK_SIZE=4096
CONFIG_LOG_PROCESS_THREAD_STACK_SIZE=100000
CONFIG_LOG_BUFFER_SIZE=8192
CONFIG_MAIN_STACK_SIZE=4096
CONFIG_ISR_STACK_SIZE=32768
CONFIG_SYSTEM_WORKQUEUE_STACK_SIZE=4096

# -- Heap
CONFIG_HEAP_MEM_POOL_SIZE=15240

Is the problem really the logging thread? Any suggestions?

Parents
  • I am running now without enabling the logging thread, by setting the following:

    CONFIG_LOG_PROCESS_THREAD=n
    CONFIG_LOG_MODE_IMMEDIATE=y
    #CONFIG_LOG_PROCESS_THREAD_STACK_SIZE=100000
    I have also added the following:
    # Thread analyzer
    CONFIG_THREAD_ANALYZER=y
    CONFIG_THREAD_NAME=y
    CONFIG_THREAD_ANALYZER_ISR_STACK_USAGE=y
    CONFIG_THREAD_ANALYZER_AUTO_INTERVAL=10
    CONFIG_THREAD_ANALYZER_AUTO=y
    CONFIG_THREAD_ANALYZER_USE_LOG=y
    CONFIG_THREAD_ANALYZER_AUTO_STACK_SIZE=4096
    Through the log, the fault happened a little different now:
    00> [01:01:48.405,303] <inf> internaluart: Requisicao Status ok
    00> [01:01:48.644,317] <inf> internaluart: Requisicao LORA ok
    00> [01:01:48.773,315] <dbg> sx12xx_common: sx12xx_lora_send: Expected air time of 171 bytes = 277ms
    00> [01:01:55.327,392] <inf> thread_analyzer: Thread analyze:
    00> [01:01:55.327,850] <inf> thread_analyzer:  BT CTLR ECDH        : STACK: unused 196 usage 708 / 904 (78 %); CPU: 0 %
    00> [01:01:55.328,460] <inf> thread_analyzer:       : Total CPU cycles used: 852
    00> [01:01:55.329,559] <inf> thread_analyzer:  BT RX               : STACK: unused 3900 usage 196 / 4096 (4 %); CPU: 0 %
    00> [01:01:55.330,200] <inf> thread_analyzer:       : Total CPU cycles used: 2
    00> [01:01:55.330,810] <inf> thread_analyzer:  BT TX               : STACK: unused 996 usage 540 / 1536 (35 %); CPU: 0 %
    00> [01:01:55.331,451] <inf> thread_analyzer:       : Total CPU cycles used: 76
    00> [01:01:55.332,427] <inf> thread_analyzer:  thread_analyzer     : STACK: unused 3180 usage 916 / 4096 (22 %); CPU: 0 %
    00> [01:01:55.333,099] <inf> thread_analyzer:       : Total CPU cycles used: 814167
    00> [01:01:55.334,960] <inf> thread_analyzer:  lora_task_id        : STACK: unused 7868 usage 2372 / 10240 (23 %); CPU: 0 %
    00> [01:01:55.335,601] <inf> thread_analyzer: [01:01:55.351,165] <inf> thread_analyzer:  internal_comm_task_id: STACK: unused 340 usage 684 / 1024 (66 %); CPU: 0 %
    00> [01:01:55.356,933] <inf> thread_analyzer:       : Total CPU cycles used: 97168
    00> [01:01:55.358,093] <inf> thread_analyzer:  ble_task_id         : STACK: unused 4308 usage 812 / 5120 (15 %); CPU: 0 %
    00> [01:01:55.358,703] <inf> thread_analyzer:       : Total CPU cycles used: 376413
    00> [01:01:55.359,771] <inf> thread_analyzer:  sysworkq            : STACK: unused 3676 usage 420 / 4096 (10 %); CPU: 0 %
    00> [01:01:55.360,412] <inf> thread_analyzer:       : Total CPU cycles used: 5224
    00> [01:01:55.361,022] <inf> thread_analyzer:  MPSL Work           : STACK: unused 780 usage 244 / 1024 (23 %); CPU: 0 %
    00> [01:01:55.366,790] <inf> thread_analyzer:       : Total CPU cycles used: 123
    00> [01:01:55.367,370] <inf> thread_analyzer:  BT_LW_WQ            : STACK: unused 628 usage 676 / 1304 (51 %); CPU: 0 %
    00> [01:01:55.368,041] <inf> thread_anal[01:01:55.384,216] <inf> thread_analyzer:  idle                : STACK: unused 3964 usage 132 / 4096 (3 %); CPU: 98 %
    00> [01:01:55.384,918] <inf> thread_analyzer:       : Total CPU cycles used: 119996721
    00> [01:01:55.390,319] <inf> thread_analyzer:  ISR0                : STACK: unused 31636 usage 1132 / 32768 (3 %)
    00> [01:02:05.390,991] <inf> thread_analyzer: Thread analyze:
    00> [01:02:05.391,448] <inf> thread_analyzer:  BT CTLR ECDH        : STACK: unused 196 usage 708 / 904 (78 %); CPU: 0 %
    00> [01:02:05.392,059] <inf> thread_analyzer:       : Total CPU cycles used: 852
    00> [01:02:05.393,157] <inf> thread_analyzer:  BT RX               : STACK: unused 3900 usage 196 / 4096 (4 %); CPU: 0 %
    00> [01:02:05.393,798] <inf> thread_analyzer:       : Total CPU cycles used: 2
    00> [01:02:05.394,439] <inf> thread_analyzer:  BT TX               : STACK: unused 996 usage 540 / 1536 (35 %); CPU: 0 %
    00> [01:02:05.395,080] <inf> thread_analyzer:       : Total CPU cycles used: 76
    00> [01:02:05.396,209] <inf> thread_analyzer:  thread_analyzer     : STACK: unused 3180 usage 916 / 4096 (22 %); CPU: 0 %
    00> [01:02:05.396,850] <inf> thread_analyzer:       : Total CPU cycles used: 816241
    00> [01:02:05.398,559] <inf> thread_analyzer:  lora_task_id        : STACK: unused 7868 usage 2372 / 10240 (23 %); CPU: 0 %
    00> [01:02:05.404,205] <inf> thread_analyzer:       : Total CPU cycles used: 56096
    00> [01:02:05.404,754] <inf> thread_analyzer:  internal_comm_task_id: STACK: unused 340 usage 684 / 1024 (66 %); CPU: 0 %
    00> [01:02:05.405,456] <inf> thread_analyzer:       : Total CPU cyc[01:02:05.421,722] <inf> thread_analyzer:  ble_task_id         : STACK: unused 4308 usage 812 / 5120 (15 %); CPU: 0 %
    00> [01:02:05.427,490] <inf> thread_analyzer:       : Total CPU cycles used: 377422
    00> [01:02:05.428,558] <inf> thread_analyzer:  sysworkq            : STACK: unused 3676 usage 420 / 4096 (10 %); CPU: 0 %
    00> [01:02:05.429,229] <inf> thread_analyzer:       : Total CPU cycles used: 5224
    00> [01:02:05.429,840] <inf> thread_analyzer:  MPSL Work           : STACK: unused 780 usage 244 / 1024 (23 %); CPU: 0 %
    00> [01:02:05.430,480] <inf> thread_analyzer:       : Total CPU cycles used: 123
    00> [01:02:05.431,060] <inf> thread_analyzer:  BT_LW_WQ            : STACK: unused 628 usage 676 / 1304 (51 %); CPU: 0 %
    00> [01:02:05.431,823] <inf> thread_analyzer:       : Total CPU cycles used: 110
    00> [01:02:05.443,359] <inf> thread_analyzer:  idle                : STACK: unused 3964 usage 132 / 4096 (3 %); CPU: 98 %
    00> [01:02:05.444,000] <inf> thread_analyzer:       : Total CPU cycles used: 120322396
    00> [01:02:05.449,523] <inf> thread_analyzer:  ISR0                : STACK: unused 31636 usage 1132 / 32768 (3 %)
    00> [01:02:06.437,408] <inf> internaluart: Requisicao Status ok
    00> [01:02:06.676,513] <inf> internaluart: Requisicao LORA ok
    00> [01:02:06.805,572] <dbg> sx12xx_common: sx12xx_lora_send: Expected air time of 171 bytes = 277ms
    00> [01:02:15.450,225] <inf> thread_analyzer: Thread analyze:
    00> [01:02:15.450,683] <inf> thread_analyzer:  BT CTLR ECDH        : STACK: unused 196 usage 708 / 904 (78 %); CPU: 0 %
    00> [01:02:15.451,385] <inf> thread_analyzer:       : Total CPU cycles used: 852
    00> [01:02:15.452,453] <inf> thread_analyzer:  BT RX               : STACK: unused 3900 usage 196 / 4096 (4 %); CPU: 0 %
    00> [01:02:15.453,094] <inf> thread_analyzer:       : Total CPU cycles used: 2
    00> [01:02:15.453,735] <inf> thread_analyzer:  BT TX               : STACK: unused 996 usage 540 / 1536 (35 %); CPU: 0 %
    00> [01:02:15.454,376] <inf> thread_analyzer:       : Total CPU cycles used: 76
    00> [01:02:15.455,352] <inf> thread_analyzer:  thread_analyzer     : STACK: unused 3180 usage 916 / 4096 (22 %); CPU: 0 %
    00> [01:02:15.455,993] <inf> thread_analyzer:       : Total CPU cycles used: 818166
    00> [01:02:15.457,794] <inf> thread_analyzer:  lora_task_id        : STACK: unused 7868 usage 2372 / 10240 (23 %); CPU: 0 %
    00> [01:02:15.463,500] <inf> thread_analyzer:       : Total CPU cycles used: 56347
    00> [01:02:15.464,050] <inf> thread_analyzer:  internal_comm_task_id: STACK: unused 340 usage 684 / 1024 (66 %); CPU: 0 %
    00> [01:02:15.464,691] <inf> thread_analyzer[01:02:15.480,957] <inf> thread_analyzer:  ble_task_id         : STACK: unused 4308 usage 812 / 5120 (15 %); CPU: 0 %
    00> [01:02:15.486,663] <inf> thread_analyzer:       : Total CPU cycles used: 378423
    00> [01:02:15.487,792] <inf> thread_analyzer:  sysworkq            : STACK: unused 3676 usage 420 / 4096 (10 %); CPU: 0 %
    00> [01:02:15.488,433] <inf> thread_analyzer:       : Total CPU cycles used: 5251
    00> [01:02:15.489,044] <inf> thread_analyzer:  MPSL Work           : STACK: unused 780 usage 244 / 1024 (23 %); CPU: 0 %
    00> [01:02:15.489,715] <inf> thread_analyzer:       : Total CPU cycles used: 123
    00> [01:02:15.490,295] <inf> thread_analyzer:  BT_LW_WQ            : STACK: unused 628 usage 676 / 1304 (51 %); CPU: 0 %
    00> [01:02:15.495,971] <inf> thread_analyzer:       : Total CPU cycles used: 110
    00> [01:02:15.497,161] <inf> thread_analyzer:  idle                : STACK: unused 3964 usage 132 / 4096 (3 %); CPU: 98 %
    00> [01:02:15.497,802] <inf> thread_analyz[01:02:15.518,859] <inf> thread_analyzer:  ISR0                : STACK: unused 31636 usage 1132 / 32768 (3 %)
    00> [01:02:24.448,974] <inf> internaluart: Requisicao Status ok
    00> [01:02:24.687,347] <inf> internaluart: Requisicao LORA ok
    00> [01:02:24.816,375] <dbg> sx12xx_common: sx12xx_lora_send: Expected air time of 172 bytes = 277ms
    00> [01:02:25.519,531] <inf> thread_analyzer: Thread analyze:
    00> [01:02:25.519,989] <inf> thread_analyzer:  BT CTLR ECDH        : STACK: unused 196 usage 708 / 904 (78 %); CPU: 0 %
    00> [01:02:25.520,599] <inf> thread_analyzer:       : Total CPU cycles used: 852
    00> [01:02:25.521,697] <inf> thread_analyzer:  BT RX               : STACK: unused 3900 usage 196 / 4096 (4 %); CPU: 0 %
    00> [01:02:25.522,338] <inf> thread_analyzer:       : Total CPU cycles used: 2
    00> [01:02:25.522,949] <inf> thread_analyzer:  BT TX               : STACK: unused 996 usage 540 / 1536 (35 %); CPU: 0 %
    00> [01:02:25.523,590] <inf> thread_analyzer:       : Total CPU cycles used: 76
    00> [01:02:25.524,566] <inf> thread_analyzer:  thread_analyzer     : STACK: unused 3180 usage 916 / 4096 (22 %); CPU: 0 %
    00> [01:02:25.525,207] <inf> thread_analyzer:       : Total CPU cycles used: 820419
    00> [01:02:25.526,977] <inf> thread_analyzer:  lora_task_id        : STACK: unused 7868 usage 2372 / 10240 (23 %); CPU: 0 %
    00> [01:02:25.527,648] <inf> thread_analyzer:       : Total CPU cycles[01:02:25.543,304] <inf> thread_analyzer:  internal_comm_task_id: STACK: unused 340 usage 684 / 1024 (66 %); CPU: 0 %
    00> [01:02:25.549,072] <inf> thread_analyzer:       : Total CPU cycles used: 98023
    00> [01:02:25.550,231] <inf> thread_analyzer:  ble_task_id         : STACK: unused 4308 usage 812 / 5120 (15 %); CPU: 0 %
    00> [01:02:25.550,872] <inf> thread_analyzer:       : Total CPU cycles used: 379431
    00> [01:02:25.551,971] <inf> thread_analyzer:  sysworkq            : STACK: unused 3676 usage 420 / 4096 (10 %); CPU: 0 %
    00> [01:02:25.552,612] <inf> thread_analyzer:       : Total CPU cycles used: 5258
    00> [01:02:25.553,222] <inf> thread_analyzer:  MPSL Work           : STACK: unused 780 usage 244 / 1024 (23 %); CPU: 0 %
    00> [01:02:25.553,863] <inf> thread_analyzer:       : Total CPU cycles used: 123
    00> [01:02:25.559,570] <inf> thread_analyzer:  BT_LW_WQ            : STACK: unused 628 usage 676 / 1304 (51 %); CPU: 0 %
    00> [01:02:25.560,211] <inf> thread_anal[01:02:25.576,843] <inf> thread_analyzer:  idle                : STACK: unused 3964 usage 132 / 4096 (3 %); CPU: 98 %
    00> [01:02:25.582,550] <inf> thread_analyzer:       : Total CPU cycles used: 120972248
    00> [01:02:25.588,043] <inf> thread_analyzer:  ISR0                : STACK: unused 31636 usage 1132 / 32768 (3 %)
    00> [01:02:29.924,682] <err> lora_task: Another LoRa device was ACKed!
    00> [01:02:29.925,109] <err> os: ***** USAGE FAULT *****
    00> [01:02:29.925,476] <err> os:   Illegal load of EXC_RETURN into PC
    00> [01:02:29.925,903] <err> os: r0/a1:  0xaaaaaaaa  r1/a2:  0xaaaaaaaa  r2/a3:  0xaaaaaaaa
    00> [01:02:29.926,452] <err> os: r3/a4:  0xaaaaaaaa r12/ip:  0xaaaaaaaa r14/lr:  0xaaaaaaaa
    00> [01:02:29.927,001] <err> os:  xpsr:  0xaaaaaa00
    00> [01:02:29.927,368] <err> os: r4/v1:  0x200038b0  r5/v2:  0x20008661  r6/v3:  0x00000000
    00> [01:02:29.927,917] <err> os: r7/v4:  0x00000000  r8/v5:  0x00000000  r9/v6:  0x00000000
    00> [01:02:29.928,436] <err> os: r10/v7: 0x00000000  r11/v8: 0x00000000    psp:  0x20011c10
    00> [01:02:29.928,955] <err> os: EXC_RETURN: 0xfffffffd
    00> [01:02:29.929,351] <err> os: Faulting instruction address (r15/pc): 0xaaaaaaaa
    00> [01:02:29.929,840] <err> os: >>> ZEPHYR FATAL ERROR 0: CPU exception on CPU 0[0m
    00> [01:02:29.940,277] <err> os: Current thread: 0x200038f8 (idle)
    00> [01:02:29.960,571] [1;31m<err> fatal_error: Resetting system[0m
Reply
  • I am running now without enabling the logging thread, by setting the following:

    CONFIG_LOG_PROCESS_THREAD=n
    CONFIG_LOG_MODE_IMMEDIATE=y
    #CONFIG_LOG_PROCESS_THREAD_STACK_SIZE=100000
    I have also added the following:
    # Thread analyzer
    CONFIG_THREAD_ANALYZER=y
    CONFIG_THREAD_NAME=y
    CONFIG_THREAD_ANALYZER_ISR_STACK_USAGE=y
    CONFIG_THREAD_ANALYZER_AUTO_INTERVAL=10
    CONFIG_THREAD_ANALYZER_AUTO=y
    CONFIG_THREAD_ANALYZER_USE_LOG=y
    CONFIG_THREAD_ANALYZER_AUTO_STACK_SIZE=4096
    Through the log, the fault happened a little different now:
    00> [01:01:48.405,303] <inf> internaluart: Requisicao Status ok
    00> [01:01:48.644,317] <inf> internaluart: Requisicao LORA ok
    00> [01:01:48.773,315] <dbg> sx12xx_common: sx12xx_lora_send: Expected air time of 171 bytes = 277ms
    00> [01:01:55.327,392] <inf> thread_analyzer: Thread analyze:
    00> [01:01:55.327,850] <inf> thread_analyzer:  BT CTLR ECDH        : STACK: unused 196 usage 708 / 904 (78 %); CPU: 0 %
    00> [01:01:55.328,460] <inf> thread_analyzer:       : Total CPU cycles used: 852
    00> [01:01:55.329,559] <inf> thread_analyzer:  BT RX               : STACK: unused 3900 usage 196 / 4096 (4 %); CPU: 0 %
    00> [01:01:55.330,200] <inf> thread_analyzer:       : Total CPU cycles used: 2
    00> [01:01:55.330,810] <inf> thread_analyzer:  BT TX               : STACK: unused 996 usage 540 / 1536 (35 %); CPU: 0 %
    00> [01:01:55.331,451] <inf> thread_analyzer:       : Total CPU cycles used: 76
    00> [01:01:55.332,427] <inf> thread_analyzer:  thread_analyzer     : STACK: unused 3180 usage 916 / 4096 (22 %); CPU: 0 %
    00> [01:01:55.333,099] <inf> thread_analyzer:       : Total CPU cycles used: 814167
    00> [01:01:55.334,960] <inf> thread_analyzer:  lora_task_id        : STACK: unused 7868 usage 2372 / 10240 (23 %); CPU: 0 %
    00> [01:01:55.335,601] <inf> thread_analyzer: [01:01:55.351,165] <inf> thread_analyzer:  internal_comm_task_id: STACK: unused 340 usage 684 / 1024 (66 %); CPU: 0 %
    00> [01:01:55.356,933] <inf> thread_analyzer:       : Total CPU cycles used: 97168
    00> [01:01:55.358,093] <inf> thread_analyzer:  ble_task_id         : STACK: unused 4308 usage 812 / 5120 (15 %); CPU: 0 %
    00> [01:01:55.358,703] <inf> thread_analyzer:       : Total CPU cycles used: 376413
    00> [01:01:55.359,771] <inf> thread_analyzer:  sysworkq            : STACK: unused 3676 usage 420 / 4096 (10 %); CPU: 0 %
    00> [01:01:55.360,412] <inf> thread_analyzer:       : Total CPU cycles used: 5224
    00> [01:01:55.361,022] <inf> thread_analyzer:  MPSL Work           : STACK: unused 780 usage 244 / 1024 (23 %); CPU: 0 %
    00> [01:01:55.366,790] <inf> thread_analyzer:       : Total CPU cycles used: 123
    00> [01:01:55.367,370] <inf> thread_analyzer:  BT_LW_WQ            : STACK: unused 628 usage 676 / 1304 (51 %); CPU: 0 %
    00> [01:01:55.368,041] <inf> thread_anal[01:01:55.384,216] <inf> thread_analyzer:  idle                : STACK: unused 3964 usage 132 / 4096 (3 %); CPU: 98 %
    00> [01:01:55.384,918] <inf> thread_analyzer:       : Total CPU cycles used: 119996721
    00> [01:01:55.390,319] <inf> thread_analyzer:  ISR0                : STACK: unused 31636 usage 1132 / 32768 (3 %)
    00> [01:02:05.390,991] <inf> thread_analyzer: Thread analyze:
    00> [01:02:05.391,448] <inf> thread_analyzer:  BT CTLR ECDH        : STACK: unused 196 usage 708 / 904 (78 %); CPU: 0 %
    00> [01:02:05.392,059] <inf> thread_analyzer:       : Total CPU cycles used: 852
    00> [01:02:05.393,157] <inf> thread_analyzer:  BT RX               : STACK: unused 3900 usage 196 / 4096 (4 %); CPU: 0 %
    00> [01:02:05.393,798] <inf> thread_analyzer:       : Total CPU cycles used: 2
    00> [01:02:05.394,439] <inf> thread_analyzer:  BT TX               : STACK: unused 996 usage 540 / 1536 (35 %); CPU: 0 %
    00> [01:02:05.395,080] <inf> thread_analyzer:       : Total CPU cycles used: 76
    00> [01:02:05.396,209] <inf> thread_analyzer:  thread_analyzer     : STACK: unused 3180 usage 916 / 4096 (22 %); CPU: 0 %
    00> [01:02:05.396,850] <inf> thread_analyzer:       : Total CPU cycles used: 816241
    00> [01:02:05.398,559] <inf> thread_analyzer:  lora_task_id        : STACK: unused 7868 usage 2372 / 10240 (23 %); CPU: 0 %
    00> [01:02:05.404,205] <inf> thread_analyzer:       : Total CPU cycles used: 56096
    00> [01:02:05.404,754] <inf> thread_analyzer:  internal_comm_task_id: STACK: unused 340 usage 684 / 1024 (66 %); CPU: 0 %
    00> [01:02:05.405,456] <inf> thread_analyzer:       : Total CPU cyc[01:02:05.421,722] <inf> thread_analyzer:  ble_task_id         : STACK: unused 4308 usage 812 / 5120 (15 %); CPU: 0 %
    00> [01:02:05.427,490] <inf> thread_analyzer:       : Total CPU cycles used: 377422
    00> [01:02:05.428,558] <inf> thread_analyzer:  sysworkq            : STACK: unused 3676 usage 420 / 4096 (10 %); CPU: 0 %
    00> [01:02:05.429,229] <inf> thread_analyzer:       : Total CPU cycles used: 5224
    00> [01:02:05.429,840] <inf> thread_analyzer:  MPSL Work           : STACK: unused 780 usage 244 / 1024 (23 %); CPU: 0 %
    00> [01:02:05.430,480] <inf> thread_analyzer:       : Total CPU cycles used: 123
    00> [01:02:05.431,060] <inf> thread_analyzer:  BT_LW_WQ            : STACK: unused 628 usage 676 / 1304 (51 %); CPU: 0 %
    00> [01:02:05.431,823] <inf> thread_analyzer:       : Total CPU cycles used: 110
    00> [01:02:05.443,359] <inf> thread_analyzer:  idle                : STACK: unused 3964 usage 132 / 4096 (3 %); CPU: 98 %
    00> [01:02:05.444,000] <inf> thread_analyzer:       : Total CPU cycles used: 120322396
    00> [01:02:05.449,523] <inf> thread_analyzer:  ISR0                : STACK: unused 31636 usage 1132 / 32768 (3 %)
    00> [01:02:06.437,408] <inf> internaluart: Requisicao Status ok
    00> [01:02:06.676,513] <inf> internaluart: Requisicao LORA ok
    00> [01:02:06.805,572] <dbg> sx12xx_common: sx12xx_lora_send: Expected air time of 171 bytes = 277ms
    00> [01:02:15.450,225] <inf> thread_analyzer: Thread analyze:
    00> [01:02:15.450,683] <inf> thread_analyzer:  BT CTLR ECDH        : STACK: unused 196 usage 708 / 904 (78 %); CPU: 0 %
    00> [01:02:15.451,385] <inf> thread_analyzer:       : Total CPU cycles used: 852
    00> [01:02:15.452,453] <inf> thread_analyzer:  BT RX               : STACK: unused 3900 usage 196 / 4096 (4 %); CPU: 0 %
    00> [01:02:15.453,094] <inf> thread_analyzer:       : Total CPU cycles used: 2
    00> [01:02:15.453,735] <inf> thread_analyzer:  BT TX               : STACK: unused 996 usage 540 / 1536 (35 %); CPU: 0 %
    00> [01:02:15.454,376] <inf> thread_analyzer:       : Total CPU cycles used: 76
    00> [01:02:15.455,352] <inf> thread_analyzer:  thread_analyzer     : STACK: unused 3180 usage 916 / 4096 (22 %); CPU: 0 %
    00> [01:02:15.455,993] <inf> thread_analyzer:       : Total CPU cycles used: 818166
    00> [01:02:15.457,794] <inf> thread_analyzer:  lora_task_id        : STACK: unused 7868 usage 2372 / 10240 (23 %); CPU: 0 %
    00> [01:02:15.463,500] <inf> thread_analyzer:       : Total CPU cycles used: 56347
    00> [01:02:15.464,050] <inf> thread_analyzer:  internal_comm_task_id: STACK: unused 340 usage 684 / 1024 (66 %); CPU: 0 %
    00> [01:02:15.464,691] <inf> thread_analyzer[01:02:15.480,957] <inf> thread_analyzer:  ble_task_id         : STACK: unused 4308 usage 812 / 5120 (15 %); CPU: 0 %
    00> [01:02:15.486,663] <inf> thread_analyzer:       : Total CPU cycles used: 378423
    00> [01:02:15.487,792] <inf> thread_analyzer:  sysworkq            : STACK: unused 3676 usage 420 / 4096 (10 %); CPU: 0 %
    00> [01:02:15.488,433] <inf> thread_analyzer:       : Total CPU cycles used: 5251
    00> [01:02:15.489,044] <inf> thread_analyzer:  MPSL Work           : STACK: unused 780 usage 244 / 1024 (23 %); CPU: 0 %
    00> [01:02:15.489,715] <inf> thread_analyzer:       : Total CPU cycles used: 123
    00> [01:02:15.490,295] <inf> thread_analyzer:  BT_LW_WQ            : STACK: unused 628 usage 676 / 1304 (51 %); CPU: 0 %
    00> [01:02:15.495,971] <inf> thread_analyzer:       : Total CPU cycles used: 110
    00> [01:02:15.497,161] <inf> thread_analyzer:  idle                : STACK: unused 3964 usage 132 / 4096 (3 %); CPU: 98 %
    00> [01:02:15.497,802] <inf> thread_analyz[01:02:15.518,859] <inf> thread_analyzer:  ISR0                : STACK: unused 31636 usage 1132 / 32768 (3 %)
    00> [01:02:24.448,974] <inf> internaluart: Requisicao Status ok
    00> [01:02:24.687,347] <inf> internaluart: Requisicao LORA ok
    00> [01:02:24.816,375] <dbg> sx12xx_common: sx12xx_lora_send: Expected air time of 172 bytes = 277ms
    00> [01:02:25.519,531] <inf> thread_analyzer: Thread analyze:
    00> [01:02:25.519,989] <inf> thread_analyzer:  BT CTLR ECDH        : STACK: unused 196 usage 708 / 904 (78 %); CPU: 0 %
    00> [01:02:25.520,599] <inf> thread_analyzer:       : Total CPU cycles used: 852
    00> [01:02:25.521,697] <inf> thread_analyzer:  BT RX               : STACK: unused 3900 usage 196 / 4096 (4 %); CPU: 0 %
    00> [01:02:25.522,338] <inf> thread_analyzer:       : Total CPU cycles used: 2
    00> [01:02:25.522,949] <inf> thread_analyzer:  BT TX               : STACK: unused 996 usage 540 / 1536 (35 %); CPU: 0 %
    00> [01:02:25.523,590] <inf> thread_analyzer:       : Total CPU cycles used: 76
    00> [01:02:25.524,566] <inf> thread_analyzer:  thread_analyzer     : STACK: unused 3180 usage 916 / 4096 (22 %); CPU: 0 %
    00> [01:02:25.525,207] <inf> thread_analyzer:       : Total CPU cycles used: 820419
    00> [01:02:25.526,977] <inf> thread_analyzer:  lora_task_id        : STACK: unused 7868 usage 2372 / 10240 (23 %); CPU: 0 %
    00> [01:02:25.527,648] <inf> thread_analyzer:       : Total CPU cycles[01:02:25.543,304] <inf> thread_analyzer:  internal_comm_task_id: STACK: unused 340 usage 684 / 1024 (66 %); CPU: 0 %
    00> [01:02:25.549,072] <inf> thread_analyzer:       : Total CPU cycles used: 98023
    00> [01:02:25.550,231] <inf> thread_analyzer:  ble_task_id         : STACK: unused 4308 usage 812 / 5120 (15 %); CPU: 0 %
    00> [01:02:25.550,872] <inf> thread_analyzer:       : Total CPU cycles used: 379431
    00> [01:02:25.551,971] <inf> thread_analyzer:  sysworkq            : STACK: unused 3676 usage 420 / 4096 (10 %); CPU: 0 %
    00> [01:02:25.552,612] <inf> thread_analyzer:       : Total CPU cycles used: 5258
    00> [01:02:25.553,222] <inf> thread_analyzer:  MPSL Work           : STACK: unused 780 usage 244 / 1024 (23 %); CPU: 0 %
    00> [01:02:25.553,863] <inf> thread_analyzer:       : Total CPU cycles used: 123
    00> [01:02:25.559,570] <inf> thread_analyzer:  BT_LW_WQ            : STACK: unused 628 usage 676 / 1304 (51 %); CPU: 0 %
    00> [01:02:25.560,211] <inf> thread_anal[01:02:25.576,843] <inf> thread_analyzer:  idle                : STACK: unused 3964 usage 132 / 4096 (3 %); CPU: 98 %
    00> [01:02:25.582,550] <inf> thread_analyzer:       : Total CPU cycles used: 120972248
    00> [01:02:25.588,043] <inf> thread_analyzer:  ISR0                : STACK: unused 31636 usage 1132 / 32768 (3 %)
    00> [01:02:29.924,682] <err> lora_task: Another LoRa device was ACKed!
    00> [01:02:29.925,109] <err> os: ***** USAGE FAULT *****
    00> [01:02:29.925,476] <err> os:   Illegal load of EXC_RETURN into PC
    00> [01:02:29.925,903] <err> os: r0/a1:  0xaaaaaaaa  r1/a2:  0xaaaaaaaa  r2/a3:  0xaaaaaaaa
    00> [01:02:29.926,452] <err> os: r3/a4:  0xaaaaaaaa r12/ip:  0xaaaaaaaa r14/lr:  0xaaaaaaaa
    00> [01:02:29.927,001] <err> os:  xpsr:  0xaaaaaa00
    00> [01:02:29.927,368] <err> os: r4/v1:  0x200038b0  r5/v2:  0x20008661  r6/v3:  0x00000000
    00> [01:02:29.927,917] <err> os: r7/v4:  0x00000000  r8/v5:  0x00000000  r9/v6:  0x00000000
    00> [01:02:29.928,436] <err> os: r10/v7: 0x00000000  r11/v8: 0x00000000    psp:  0x20011c10
    00> [01:02:29.928,955] <err> os: EXC_RETURN: 0xfffffffd
    00> [01:02:29.929,351] <err> os: Faulting instruction address (r15/pc): 0xaaaaaaaa
    00> [01:02:29.929,840] <err> os: >>> ZEPHYR FATAL ERROR 0: CPU exception on CPU 0[0m
    00> [01:02:29.940,277] <err> os: Current thread: 0x200038f8 (idle)
    00> [01:02:29.960,571] [1;31m<err> fatal_error: Resetting system[0m
Children
No Data
Related