Debugging in VSCode gets stuck booting Zephyr OS

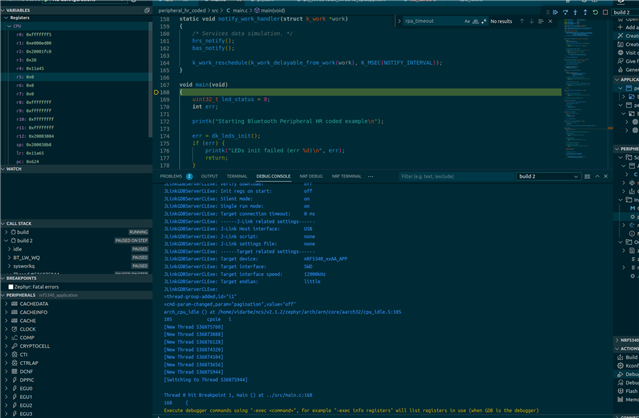
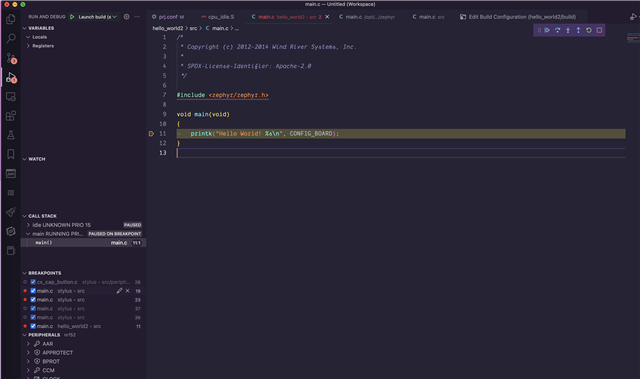
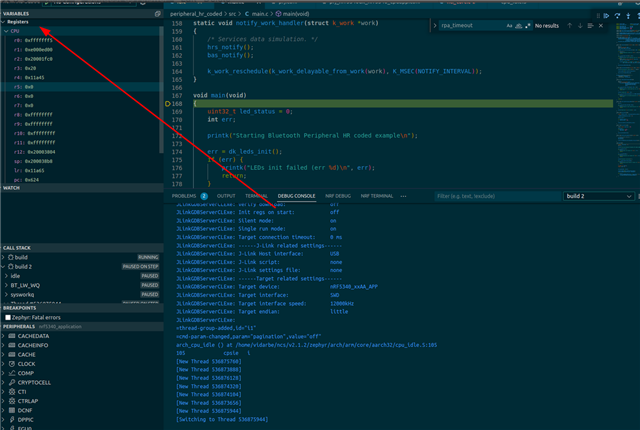
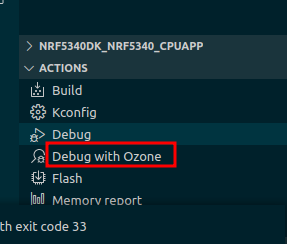
I've been trying to get breakpoints working on a new nRF Connect project but have been running into an issue: when I hit "Debug" in the nRF Connect plugin in VSCode, the app compiles, loads, and logs everything from my application, but seems to ignore the breakpoints. Then, it seems to reboot, because it says it's loading Zephyr again, but this time it never succeeds. The call stack on the left has values but then quickly becomes empty.

I am using a nRF52DK (nRF52832) and am also experiencing the same issue with a BMD-300 Dev Kit.
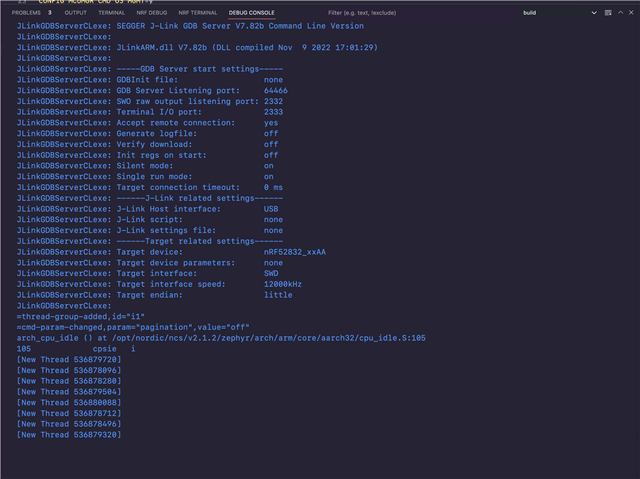
Here is the log:


*** Booting Zephyr OS build v3.1.99-ncs1-1 ***
I: Starting bootloader
I: Primary image: magic=unset, swap_type=0x1, copy_done=0x3, image_ok=0x3
I: Secondary image: magic=unset, swap_type=0x1, copy_done=0x3, image_ok=0x3
I: Boot source: none
I: Swap type: none
I: Bootloader chainload address offset: 0xc000
�*** Booting Zephyr OS build v3.1.99-ncs1-1 ***
[00:00:00.004,699] <inf> [Logs from myapp showing that the main() function finished successfully.]
*** Booting Zephyr OS build v3.1.99-ncs1-1 ***

The device seems to hang at this point and isn't advertising via BLE. When I load the same app without the debugger, it advertises and works perfectly.

A few things I have already tried:
1. I made sure the "Enable debug options" is checked for my build configuration and did a pristine build
2. I restarted VSCode
3. I unplugged and plugged in the device

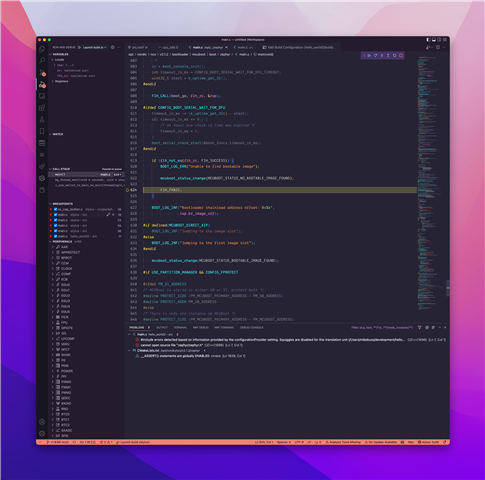
I've attached an image of the setup if that's helpful.

Any help you could provide would be greatly appreciated. Thank you.

Parents Reply Children
  • Thank you for the quick response. Pressing the Pause button doesn't seem to do anything. The Debug Console window doesn't seem to show any errors (see attached image). 


    Sorry for the basic question: what peripheral would I need to look at on the left to see the program counter?

    One thing I tried was disabling the "Enable debug options", creating a pristine build, and running the debugger. This seems to break inside "cpu_idle" when run and then a FIH_PANIC spot (see screenshot) when I hit pause, but continuing doesn't continue past when I hit continue (F5). I assume this is going down the wrong path but maybe it's helpful for debugging the problem?

    When I switch to the sample hello_world application on the same board the breakpoints work just fine.

  • One thing that's a clear difference between the hello_world example and my application is there's no "[Switching to Thread abcd]" after the [New Thread] lines in the debug console output of my application. It's like it gets stuck somewhere.

    Here is the full debug console output for my app:

    JLinkGDBServerCLexe: SEGGER J-Link GDB Server V7.82b Command Line Version
    JLinkGDBServerCLexe: 
    JLinkGDBServerCLexe: JLinkARM.dll V7.82b (DLL compiled Nov  9 2022 17:01:29)
    JLinkGDBServerCLexe: 
    JLinkGDBServerCLexe: -----GDB Server start settings-----
    JLinkGDBServerCLexe: GDBInit file:                  none
    JLinkGDBServerCLexe: GDB Server Listening port:     65228
    JLinkGDBServerCLexe: SWO raw output listening port: 2332
    JLinkGDBServerCLexe: Terminal I/O port:             2333
    JLinkGDBServerCLexe: Accept remote connection:      yes
    JLinkGDBServerCLexe: Generate logfile:              off
    JLinkGDBServerCLexe: Verify download:               off
    JLinkGDBServerCLexe: Init regs on start:            off
    JLinkGDBServerCLexe: Silent mode:                   on
    JLinkGDBServerCLexe: Single run mode:               on
    JLinkGDBServerCLexe: Target connection timeout:     0 ms
    JLinkGDBServerCLexe: ------J-Link related settings------
    JLinkGDBServerCLexe: J-Link Host interface:         USB
    JLinkGDBServerCLexe: J-Link script:                 none
    JLinkGDBServerCLexe: J-Link settings file:          none
    JLinkGDBServerCLexe: ------Target related settings------
    JLinkGDBServerCLexe: Target device:                 nRF52832_xxAA
    JLinkGDBServerCLexe: Target device parameters:      none
    JLinkGDBServerCLexe: Target interface:              SWD
    JLinkGDBServerCLexe: Target interface speed:        12000kHz
    JLinkGDBServerCLexe: Target endian:                 little
    JLinkGDBServerCLexe: 
    =thread-group-added,id="i1"
    =cmd-param-changed,param="pagination",value="off"
    arch_cpu_idle () at /opt/nordic/ncs/v2.1.2/zephyr/arch/arm/core/aarch32/cpu_idle.S:105
    105		cpsie	i
    [New Thread 536879720]
    [New Thread 536878096]
    [New Thread 536878280]
    [New Thread 536879504]
    [New Thread 536880088]
    [New Thread 536878712]
    [New Thread 536878496]
    [New Thread 536879320]

    And here is the full debug console output for hello_world:

    JLinkGDBServerCLexe: SEGGER J-Link GDB Server V7.82b Command Line Version
    JLinkGDBServerCLexe: 
    JLinkGDBServerCLexe: JLinkARM.dll V7.82b (DLL compiled Nov  9 2022 17:01:29)
    JLinkGDBServerCLexe: 
    JLinkGDBServerCLexe: -----GDB Server start settings-----
    JLinkGDBServerCLexe: GDBInit file:                  none
    JLinkGDBServerCLexe: GDB Server Listening port:     65299
    JLinkGDBServerCLexe: SWO raw output listening port: 2332
    JLinkGDBServerCLexe: Terminal I/O port:             2333
    JLinkGDBServerCLexe: Accept remote connection:      yes
    JLinkGDBServerCLexe: Generate logfile:              off
    JLinkGDBServerCLexe: Verify download:               off
    JLinkGDBServerCLexe: Init regs on start:            off
    JLinkGDBServerCLexe: Silent mode:                   on
    JLinkGDBServerCLexe: Single run mode:               on
    JLinkGDBServerCLexe: Target connection timeout:     0 ms
    JLinkGDBServerCLexe: ------J-Link related settings------
    JLinkGDBServerCLexe: J-Link Host interface:         USB
    JLinkGDBServerCLexe: J-Link script:                 none
    JLinkGDBServerCLexe: J-Link settings file:          none
    JLinkGDBServerCLexe: ------Target related settings------
    JLinkGDBServerCLexe: Target device:                 nRF52832_xxAA
    JLinkGDBServerCLexe: Target device parameters:      none
    JLinkGDBServerCLexe: Target interface:              SWD
    JLinkGDBServerCLexe: Target interface speed:        12000kHz
    JLinkGDBServerCLexe: Target endian:                 little
    JLinkGDBServerCLexe: 
    =thread-group-added,id="i1"
    =cmd-param-changed,param="pagination",value="off"
    arch_cpu_idle () at /opt/nordic/ncs/v2.1.2/zephyr/arch/arm/core/aarch32/cpu_idle.S:105
    105		cpsie	i
    [New Thread 536871104]
    [New Thread 536871280]
    [Switching to Thread 536871280]
    
    Thread 3 hit Breakpoint 1, main () at ../src/main.c:11
    11		printk("Hello World! %s\n", CONFIG_BOARD);
    Execute debugger commands using "-exec <command>", for example "-exec info registers" will list registers in use (when GDB is the debugger)

  • It's interesting that it works fine with the "hello world" sample. This indicates that the debugger and everything is configured correctly, at least.

    Maybe you can try to build your application without the bootloader (CONFIG_BOOTLOADER_MCUBOOT=n) to see if it works better when you only have one FW image. This may help narrow down the problem.

    The CPU registers can be viewed in the top left corner here:

    deveryn said:
    One thing I tried was disabling the "Enable debug options", creating a pristine build, and running the debugger. This seems to break inside "cpu_idle" when run and then a FIH_PANIC spot (see screenshot) when I hit pause, but continuing doesn't continue past when I hit continue (F5). I assume this is going down the wrong path but maybe it's helpful for debugging the problem?

    This shows that the program hangs inside MCUBoot because it did not find a bootable app. This can happen if only the mcuboot image is programmed to the device instead (i.e. if the zephyr.hex in build/mcuboot/zephyr/ was programmed instead of the merged.hex in build/zephyr)

  • Thank you for getting back to me. Setting CONFIG_BOOTLOADER_MCUBOOT to "n" did seem to fix the issue - the breakpoints are hit and I can walk through the app.

    While debugging this, I accidentally stopped a flash halfway through, which made the J-Link debugger not respond when programming with VSCode. I used the nRF Connect desktop app to program the merged.hex file. Then, all of a sudden, the debugging started working with and without the CONFIG_BOOTLOADER_MCUBOOT=n value!

    Do you know why this would happen so I can avoid running into the issue in the future?

    Either way, thank you for your help!

  • I'm glad to hear that it works now, but I'm afraid I don't have an explanation as to why this issue occured in the first place. I tried to reproduce the problem here by debugging a project which included MCUBoot, but no luck. 

    If you happen to encounter this again, please try to use Segger Ozone to see if it gives you the same problem. I'm trying to understand if the issue may be related to the debugger configuration or not.

    The "Debug with Ozone" button should appear here if you have Ozone installed:

Related