Debugging in VS Code: does not halt in main() and can not view peripherals

Hi there!

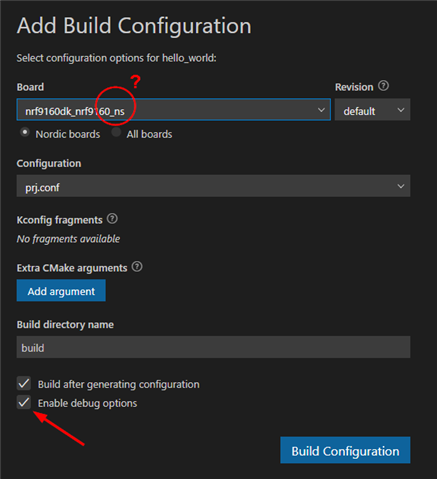
I'm using nRF Connect SDK v2.1.2 and VS Code 1.73.1 with nRF Connect extensions on a Windows 11 x64 machine. I created a Freestanding application based on the nrf/applications/asset_tracker_v2 as a starting point for the Thingy:91

Coming from Segger Embedded Studio + nRF5 SDK 17.0.2, I'm completely new to this dev system and any pointers will be much appreciated. I learned (the hard way) that I had to disable debug options in the build configuration for debugging to work at all.

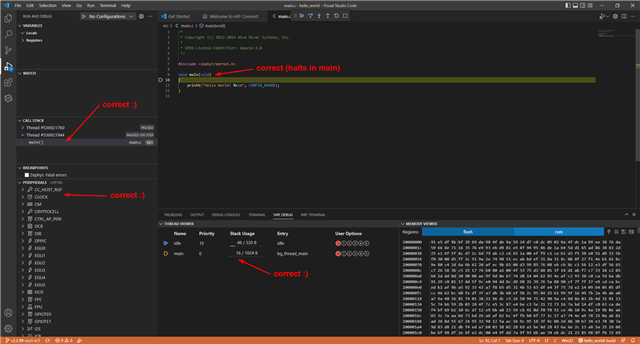
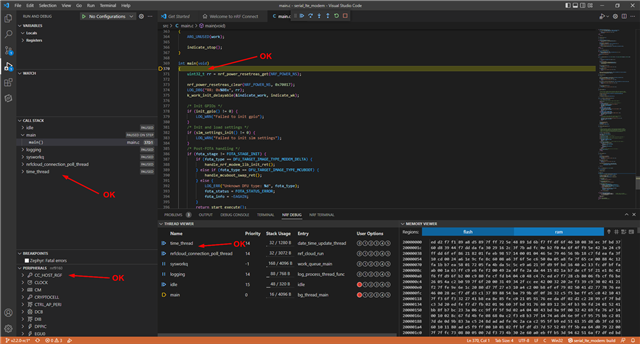
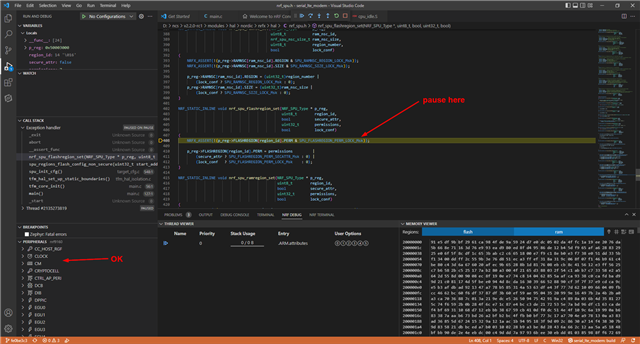
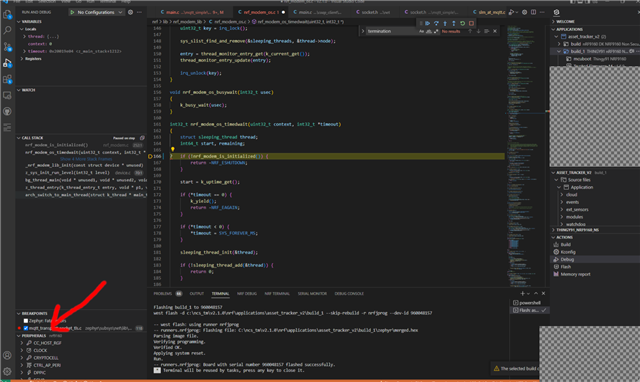
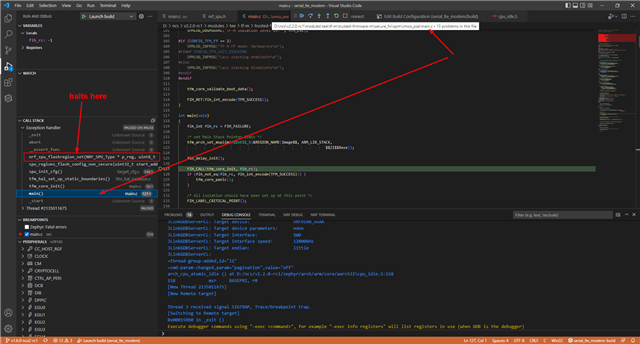
When I start debugging, it programs the nRF9160 and breaks here in cpu_idle.S, not main():

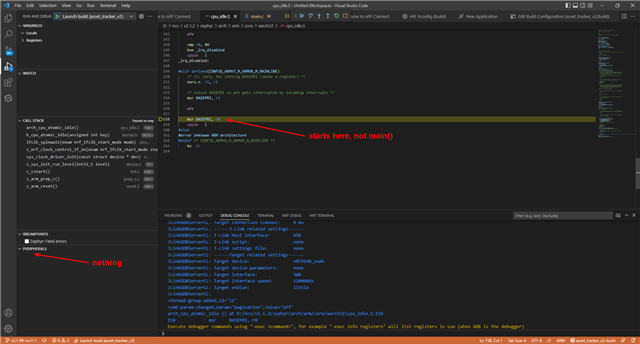
It also does not show any peripherals. I can put a breakpoint somewhere in main(), run and it will break there.

I created a launch.json file and here is the content:

{
    // Use IntelliSense to learn about possible attributes.
    // Hover to view descriptions of existing attributes.
    // For more information, visit: https://go.microsoft.com/fwlink/?linkid=830387
    "version": "0.2.0",
    "configurations": [
        {
            "type": "nrf-connect",
            "request": "launch",
            "name": "Launch active build configuration",
            "config": "${activeConfig}",
            "runToEntryPoint": "main"
        },
        {
            "name": "Launch build",
            "type": "nrf-connect",
            "request": "launch",
            "config": "d:\\Work\\PICONOMIX\\projects-contract\\DAU\\Thingy91\\firmware\\asset_tracker_v2\\build",
            "runToEntryPoint": "main",
            "svdFile": "d:\\ncs\\v2.1.2\\modules\\hal\\nordic\\nrfx\\mdk\\nrf9160.svd"
        }
    ]
}

So the "runToEntryPoint" field means that it is supposed to stop in main(), right?

I added the "svdFile" field to see if I could fix the "PERIPHERALS" view but that property name is not valid.

How do I fix this? Must I install and use the Cortex-Debug extension?

Thanks in advance,

Pieter

https://piconomix.com

  • Hi Sigurd,

    Thanks for the advice :) I should start with a small sample and work my way up to the full app.

    I have built the zephyr/samples/hello_world with debugging options enabled for the Thingy:91 and everything looks good! The call stack, peripherals window and thread viewer looks correct and the debugger halts in main():

    I can build & debug nrf/samples/nrf9160/at_client for the nRF9160DK. Everything looks OK too.

    I can build & debug nrf/applications/serial_lte_modem for the nRF9160DK. Everything looks OK too:

    When I build nrf/applications/serial_lte_modem for the Thingy:91 with debugging options enabled, the debugger does not halt in main(). When I halt the processor, I can see that it's stuck in nrf_spu_flashregion_set():

    When building the project, I see a warning "Changed board to secure thingy91_nrf9160 (NOT NS).. could this be the source of the problem?

    It looks like the problem was discussed in this Q&A and a possible solution posted but I don't know how to apply it (I tried with a monkey-see-monkey-do approach without success):

    https://devzone.nordicsemi.com/f/nordic-q-a/92915/mcuboot-stuck-after-jumping-to-first-image-slot/395158

    I am now stuck at this step before progressing to asset_tracker_v2. Can you at least confirm that you are able to build asset_tracker_v2 for thingy91_nrf9160_ns target with debugging options enabled? Or will it always be too big to fit in FLASH?

    Thanks in advance,

    Pieter

    P.S. I can confirm that the peripherals view seems to work for the new release (v2.2.0_rc1).

    P.S.S. Apologies for multiple issues in one Q&A. Should I split it up into several Q&As?

  • pieterc said:
    P.S.S. Apologies for multiple issues in one Q&A. Should I split it up into several Q&As?

    No need, this is fine.

    Very good to see you try every step, it gives me a lot of information!

    Let me first explain secure and non-secure.
    Short answer: You need to build as "_ns" to use the modem with the nRF9160. Therefore you in practice always use nrf9160dk_nrf9160_ns
    Long answer: An Introduction to Trusted Firmware-M (TF-M)

    pieterc said:
    When building the project, I see a warning "Changed board to secure thingy91_nrf9160 (NOT NS).. could this be the source of the problem?

    This should not be a problem.
    I believe that this is the build system which builds for both secure and non-secure in the build.

    pieterc said:
    P.S. I can confirm that the peripherals view seems to work for the new release (v2.2.0_rc1).

    For Asset Tracker v2 also?

    pieterc said:
    I am now stuck at this step before progressing to asset_tracker_v2. Can you at least confirm that you are able to build asset_tracker_v2 for thingy91_nrf9160_ns target with debugging options enabled? Or will it always be too big to fit in FLASH?

    I get the same error as you when enabling Debug Options.
    The project is just a bit too large in general for this.
    Maybe you could make it fit with the proper configurations.

    However, I am able to see peripherals for Asset Tracker v2 when building without debug options.

    nRF Connect SDK: v2.1.2
    Board: thingy91_nrf9160_ns
    Sample: asset_tracker_v2
    Debugging Options: off

    As you can see, I am able to see peripherals even without Debugging Options.

    pieterc said:
    When I build nrf/applications/serial_lte_modem for the Thingy:91 with debugging options enabled, the debugger does not halt in main(). When I halt the processor, I can see that it's stuck in nrf_spu_flashregion_set():

    Looks like I am able to stop at this line here in serial_lte_modem.

    Try to put multiple breakpoints in main to check if you can stop anyplace in main at all?

    Regards,
    Sigurd Hellesvik

  • Hi Sigurd,

    I can confirm that I see the peripheral view in asset_tracker_v2 with debug options not enabled:

    It halts in cpu_idle.S but I can put breakpoints in main and the code runs to the breakpoint. All good, thanks Slight smile

    When I try to program & debug serial_lte_modem with debugging options enabled, it does not get to the application main(). When I halt it, you will see from the call stack that it is in the TF-M's main():

    There are hints on how to fix it here, but I don't know how to implement it:

    https://devzone.nordicsemi.com/f/nordic-q-a/92915/mcuboot-stuck-after-jumping-to-first-image-slot/395158

    Thanks for sharing the Introduction to Trusted Firmware-M. I will work through it now.

    Regards,

    Pieter

  • Hi Pieter,

    I am able to reproduce the issue with serial_lte_modem on my side as well.

    But when I build without Debug Configurations, the debugging works fine for serial_lte_modem.
    Can you test this on your side as well?

    Regards,
    Sigurd Hellesvik

  • Hi Sigurd,

    Yes I can confirm that debugging works for serial_lte_modem without Debug Configurations. Peripheral view works but Thread View does not.

    Regards,

    Pieter

Related