Understanding a FATAL ERROR in my application

My application is pretty consistently encountering a fatal error.  The output from the SWD debug:

E: ***** MPU FAULT *****
E:   Instruction Access Violation
E: r0/a1:  0x20001df0  r1/a2:  0x200187b0  r2/a3:  0x00000000
E: r3/a4:  0x20001c90 r12/ip:  0x00000000 r14/lr:  0x0003fda5
E:  xpsr:  0x60000000
E: Faulting instruction address (r15/pc): 0x20001c90
E: >>> ZEPHYR FATAL ERROR 0: CPU exception on CPU 0
E: Current thread: 0x20001c90 (BT RX)

Following the advice of another post on Devzone, I set `CONFIG_RESET_ON_FATAL_ERROR=n` and used the Run and Debug extension in VSCode.  Sure enough, it stopped on the error:
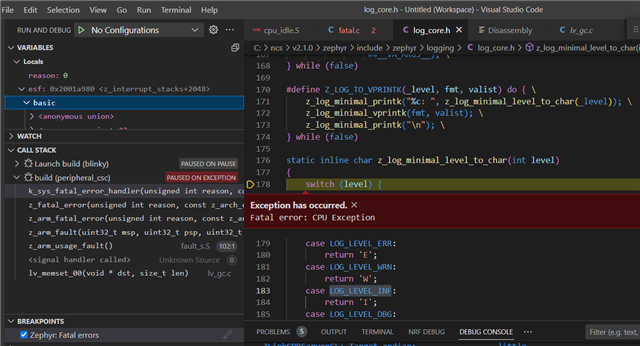
Here's where I'm struggling a bit.  The call stack:

k_sys_fatal_error_handler(unsigned int reason, const z_arch_esf_t * esf) (c:\ncs\v2.1.0\zephyr\include\zephyr\logging\log_core.h:178)
z_fatal_error(unsigned int reason, const z_arch_esf_t * esf) (c:\ncs\v2.1.0\zephyr\kernel\fatal.c:131)
z_arm_fatal_error(unsigned int reason, const z_arch_esf_t * esf) (c:\ncs\v2.1.0\zephyr\arch\arm\core\aarch32\fatal.c:63)
z_arm_fault(uint32_t msp, uint32_t psp, uint32_t exc_return, _callee_saved_t * callee_regs) (c:\ncs\v2.1.0\zephyr\arch\arm\core\aarch32\cortex_m\fault.c:1070)
z_arm_usage_fault() (c:\ncs\v2.1.0\zephyr\arch\arm\core\aarch32\cortex_m\fault_s.S:102)
<signal handler called> (Unknown Source:0)
lv_memset_00(void * dst, size_t len) (c:\ncs\v2.1.0\modules\lib\gui\lvgl\src\misc\lv_gc.c:42)

Doesn't include any of my application code.  Maybe because this is a thread spawned from the Kernel and nothing in my application?

Regardless, the error and location seem odd. It throws an "Instruction Access Violation` in a section of code that converts the log level to a character.  I assume something is awry with my use of the `LOG_INF` macro in my application?

Edit:

A few other things have me confused:

  • The thread is described as `(BT RX)`, what could cause a Bluetooth thread to have an instruction access violation on a log line?
  • It says `Faulting Instruction `Faulting instruction address (r15/pc): 0x20001c90` - However that's the thread ID, not an instruction address?  Looking in the dissasembly viewer I'm struggling to find that address, however, I also can't figure out how to search it
  • If I had to guess, I'd say the fault is happening because r15/pc doesn't actually point to instruction memory.  Possibly, it was restored from a corrupted stack or thread context struct, or the code jumped to a corrupt function pointer.

    What is the code around r14/lr, 0x0003fda5?

    Any possibility of a use-after-free or buffer overrun in the application code?

  • Hi

    My guess would be a null pointer issue, caused by a memset call in lv_gc.c (line 42). 

    If the BT_RX thread is the culprit I assume you are calling some LVGL functions from a Bluetooth callback in your code?

    Possibly you are passing an invalid pointer to one of these functions?

    In general calling various libraries from callbacks directly can be risky, since callbacks are often running in interrupt context, and it is limited what you can do from interrupts directly. I noticed this myself in the context of trying to combine LVGL and Bluetooth. But in this particular case the issue seems more pointer related. 

    If you are unable to figure it out, would you be able to share your code? 

    Best regards
    Torbjørn

  • Thanks - I am using LVGL and Bluetooth, but there are no calls to the LVGL library outside of my main thread, so the fact that a Bluetooth RX thread throws an invalid exception on that line does not make any sense.

    The issue is definitely in my control point write callback for my FTMS implementation.  I think I'm mishandling the copying of the param structure to the response (indication per the standard).  I'm going to try process of elimination to isolate the offending line.  If I get stuck I'll share my code (it's a bit messy, I don't want to burden someone else reviewing it until I can isolate it better).

    I think at the end of it where I'll probably want some clarity is why the debugger was so unhelpful.  Seems like maybe it thinks it executing a section of code it shouldn't be?

  • Dissassembly just has a `??` for 0x0003fda5, which I guess makes sense given the instruction address is invalid.


    I think the issue might be buffer overrun, I'm going to poke more and share my code if I'm stuck.

  • Just an update - I did find a buffer be buffer overrun in a write characteristic callback.  In no way was it related to LVGL, so I'm still at a loss with that call stack and why the error was thrown in lv_gc.c?

    I will close this ticket now.

Related