Understanding a FATAL ERROR in my application

My application is pretty consistently encountering a fatal error.  The output from the SWD debug:

Following the advice of another post on Devzone, I set `CONFIG_RESET_ON_FATAL_ERROR=n` and used the Run and Debug extension in VSCode.  Sure enough, it stopped on the error:
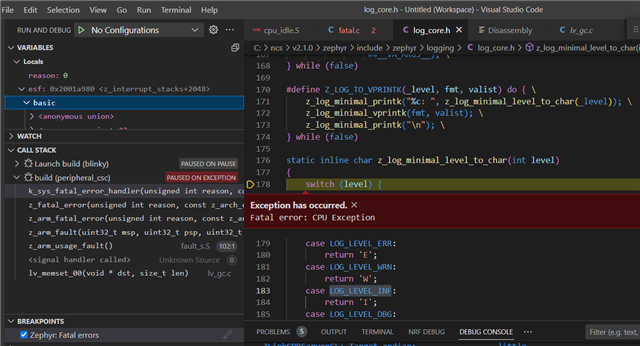
Here's where I'm struggling a bit.  The call stack:

Doesn't include any of my application code.  Maybe because this is a thread spawned from the Kernel and nothing in my application?

Regardless, the error and location seem odd. It throws an "Instruction Access Violation` in a section of code that converts the log level to a character.  I assume something is awry with my use of the `LOG_INF` macro in my application?

Edit:

A few other things have me confused:

  • The thread is described as `(BT RX)`, what could cause a Bluetooth thread to have an instruction access violation on a log line?
  • It says `Faulting Instruction `Faulting instruction address (r15/pc): 0x20001c90` - However that's the thread ID, not an instruction address?  Looking in the dissasembly viewer I'm struggling to find that address, however, I also can't figure out how to search it
Parents
  • Hi

    My guess would be a null pointer issue, caused by a memset call in lv_gc.c (line 42). 

    If the BT_RX thread is the culprit I assume you are calling some LVGL functions from a Bluetooth callback in your code?

    Possibly you are passing an invalid pointer to one of these functions?

    In general calling various libraries from callbacks directly can be risky, since callbacks are often running in interrupt context, and it is limited what you can do from interrupts directly. I noticed this myself in the context of trying to combine LVGL and Bluetooth. But in this particular case the issue seems more pointer related. 

    If you are unable to figure it out, would you be able to share your code? 

    Best regards
    Torbjørn

  • Just an update - I did find a buffer be buffer overrun in a write characteristic callback.  In no way was it related to LVGL, so I'm still at a loss with that call stack and why the error was thrown in lv_gc.c?

    I will close this ticket now.

Reply
  • Just an update - I did find a buffer be buffer overrun in a write characteristic callback.  In no way was it related to LVGL, so I'm still at a loss with that call stack and why the error was thrown in lv_gc.c?

    I will close this ticket now.

Children
  • Hi Nathan

    Is it possible that the buffer overrun started writing into some of the variables used by the LVGL library?

    If you look at the map file you should see which variables come after the one that was overrun, which might explain why it failed like it did. 

    Either way, good to hear you were able to find the root cause. 

    Best regards
    Torbjørn

  • That was my thinking, but I didn't consider looking at the map file to see what would have been overwritten.

  • The map file can often be a useful debugging tool with issues like these. It is simply called zephyr.map, and can be found next to zephyr.hex in the build folder.