segger embedded studio data breakpoints expressions nRF52833

Hello,

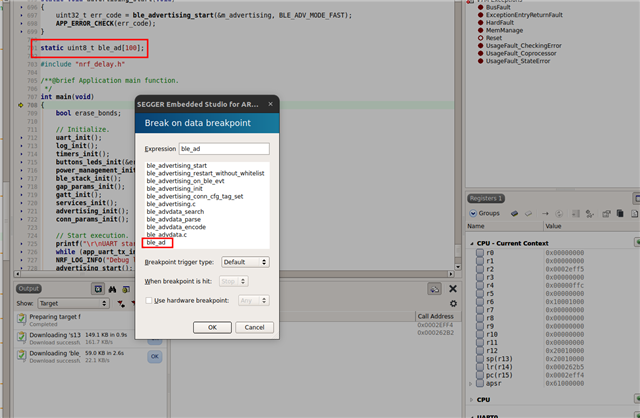
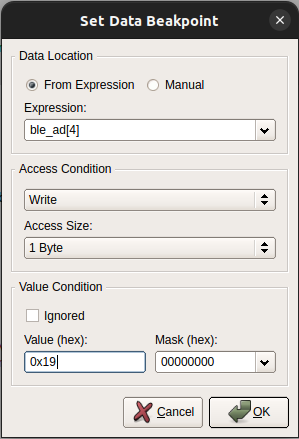
I am trying to set a data breakpoint expression on a global array or global variable  but I don't seem to be able to.

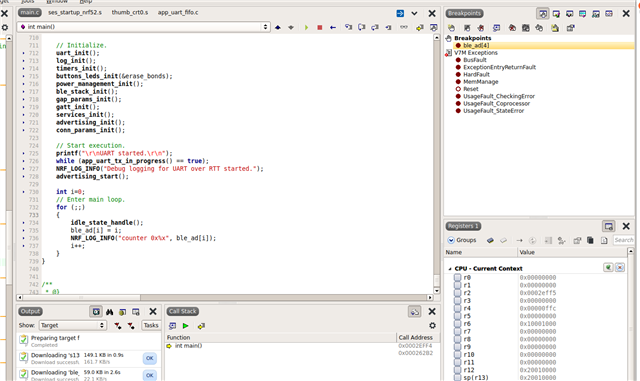
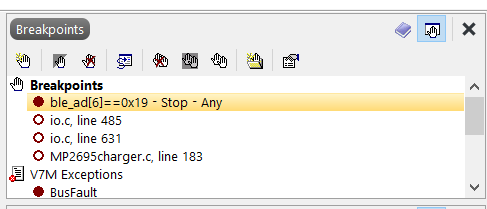
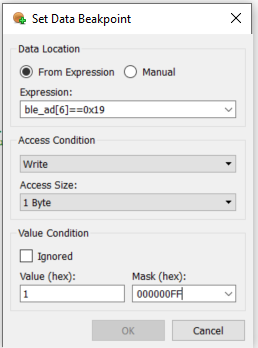
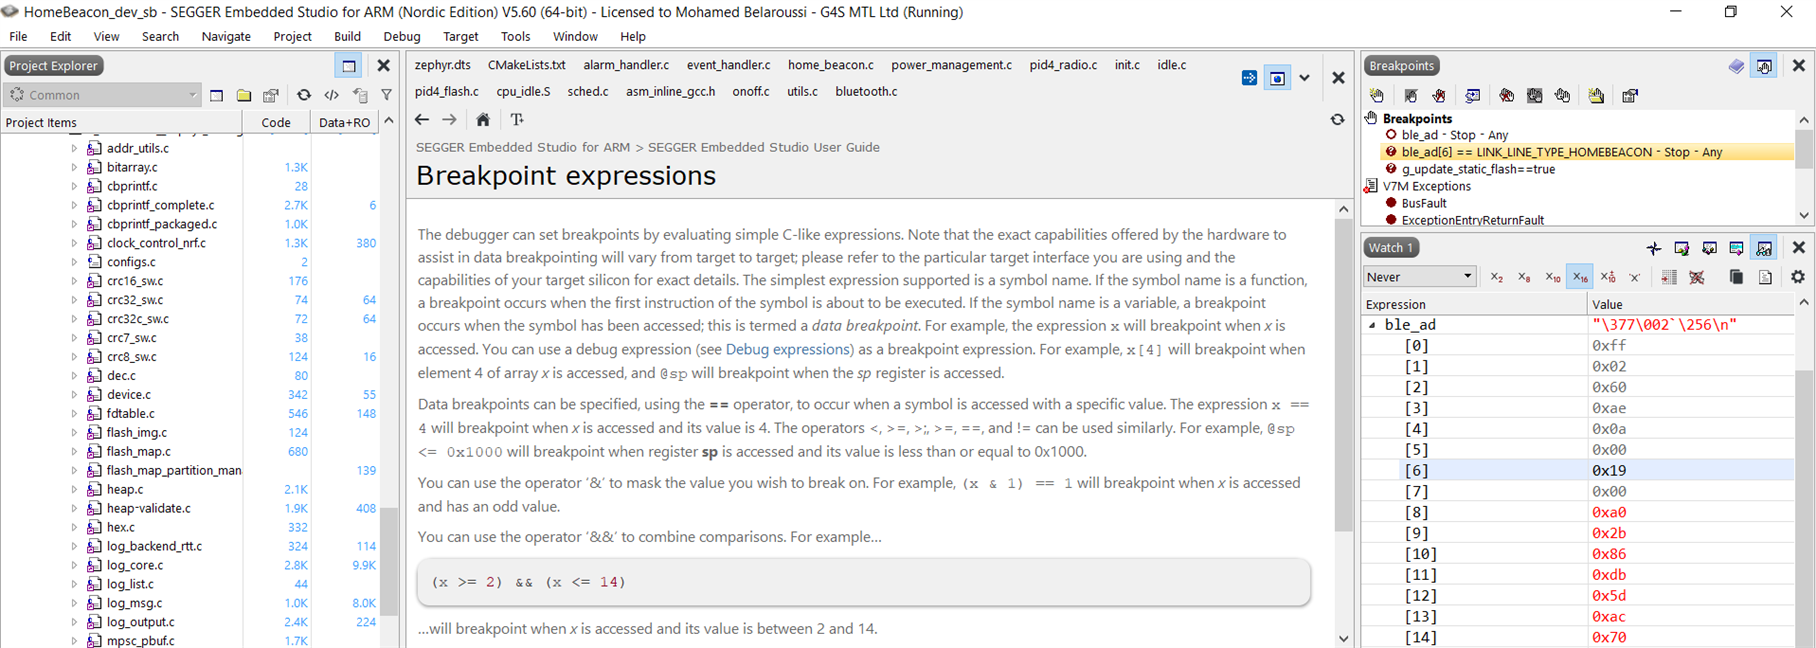
Each time I set a data breakpoint I get a '?' next to the breakpoint. See attached picture.

uint8_t ble_ad[HB_BLE_AD_BUFF_SIZE_MAX].

I am using segger Embedded Studio v5.60 and nRF52833 SoC.

Thank you.

Kind regards

Mohamed

Parents
  • Hello Mohamed,

    I created a global array named 'ble_ad' to try and reproduce this here, but it seemed to work for me. In your case, when you start typing your expression, does the variable get displayed up in the suggestion list as shown here:

    ?

    Kind regards,

    Vidar

  • Hi Vidar,

    Thank you for the quick response.

    What you did worked for me too. I ran into problems when I tried to use a data breakpoint expression applied to that variable. I suggest you edit your data breakpoint and try to use the expression I am using ble_ad[4] != 0 or any other C-like expression.

    After restarting SES IDE I can now set the data breakpoint expression without getting the '?' next to it. Very odd!

    However, the program is not breaking as expected. I checked this by setting a breakpoint at the line where ble_ad[6] is assigned the value 0x19 and it does execute this line an breaks.

    ble_ad[6] = LINK_LINE_TYPE_HOMEBEACON;

    Note, is an enum, defined ia header file as

    typedef enum eLinkLineType
    {
        LINK_LINE_TYPE_AGENCY = 0x00, /**< ? */
        LINK_LINE_TYPE_BUILDING_OWN = 0x01, /**< ? */

        ...
        LINK_LINE_TYPE_HOMEBEACON               = 0x19U,

        ...

    } link_PacketType_t;

    Thank you.

    Kind regards

    Mohamed

  • Hi Vidar,

    I downloaded Ozone and got it running but I still cannot set a data breakpoint with a C-like expression. See screen capture below. The OK field remains always greyed out and the only option available is 'Cancel'. What am I doing wrong?

    Kind regards

    Mohamed

  • Hi Mohammed,

    In Ozone, the value condition is specified at the end and not as a part of the expression. Please try to do it like this:

    Also, notice that the value mask is set to '0'. '1's in the mask are used to mark bits to ignore. 

    Kind regards,

    Vidar

  • Great! it works now Thank you. The moral is "Read the user manual" Slight smile

    I am chasing an intermittent bug which could be caused by a possible stack overflow. How do I set a data breakpoint that is triggered when ble_[6] != 0x19?

    One more question. how do I capture the debugging logs appearing in the Terminal window in a text file automatically?

    Kind regards

    Mohamed

  • I am glad to hear that it worked! 

    I am chasing an intermittent bug which could be caused by a possible stack overflow. How do I set a data breakpoint that is triggered when ble_[6] != 0x19?

    I do not think the HW comparators on Cortex M4 support these kinds of expressions. It does not appear to be supported in Ozone, at least. 

    An alternative (not as good as a breakpoint) may be to use trace in Ozone and sample the register value periodically. This way you can monitor whether the array element is overwritten or not.

    One more question. how do I capture the debugging logs appearing in the Terminal window in a text file automatically?

    The documentation explains how you can do it in Ozone, but it is not something I have tried myself. For SES you can do it like this:

  • Good Morning Vidar,

    An alternative (not as good as a breakpoint) may be to use trace in Ozone and sample the register value periodically. This way you can monitor whether the array element is overwritten or not.

    I am not sure how to do this. Could you please give me an idiot step by step guide ?

    Thank you.

    Kind regards

    Mohamed

Reply Children
  • Hi Mohamed,

    I am not sure what you have tried so far, but it seems like you have to do is to open the 'Data sampling' view and then input your expression. It is the first time I have used this myself.

    Kind regards,

    Vidar

  • Hi Vidar,

    Thank you.

    As you said, this is not as good as a breakpoint because I need to monitor it.

    In order to check if I am running out of stack I would like to fill the stack memory section with say 0xAA and run the program until it crashes. I then check if all the AA in the stack locations have disappeared i.e. overwritten. However, I am not sure where to find where the stack starts and whether it builds up or down. I looked in the .map file but it is not clear. All I know is I am setting the stack size to 8192 bytes in prj.conf.

    CONFIG_MAIN_STACK_SIZE=8192
    CONFIG_SYSTEM_WORKQUEUE_STACK_SIZE=2048

    I have only one main thread from which I am submitting a work queue. The code looks something like this,

    static struct k_work WorkQ1;

    void main( void )
    {

    ...[snip]...

    k_work_init( &WorkQ1, WorkQ1_tasks );

    ...

    k_work_submit( &WorkQ1 );

    ...[snip]

    }

    So, please help me find where the stack starts and whether it builds up or down.

    Thank you.

    Kind regards

    Mohamed

  • Hi Mohamed,

    The 'data sampling' feature is used for monitoring a variable over time. The only reason it may not be as good as a data breakpoint in this case is that it will not halt the CPU if an invalid value is written.

    There are multiple stacks (main stack for interrupt handling + 1 stack for each thread - stack pointers). The stack area allocated to each thread can be found in the map file.

    There is already a built-in stack guard to catch stack overruns and it should be enabled by default in the board files (MPU-assisted stack overflow detection). If you are unsure if it is enabled, you can check if CONFIG_MPU_STACK_GUARD=y is included in your <build folder>/zephyr/.config file.

    Kind regards,

    Vidar

  • Good Morning Vidar,

    The stack area allocated to each thread can be found in the map file.

    I am attaching my map file please let me know where the stack area is.

    /cfs-file/__key/communityserver-discussions-components-files/4/2437.zephyr.map

    If you are unsure if it is enabled, you can check if CONFIG_MPU_STACK_GUARD=y

    It is already enabled in my .config file and this is the error I am getting. There is no mention of stack overflow violation but I am suspecting there is. So, what else could be causing this fault ?

    [00:19:08.163,787] \033[1;31m<err> os: ***** MPU FAULT *****\033[0m
    [00:19:08.163,787] \033[1;31m<err> os: Instruction Access Violation\033[0m
    [00:19:08.163,787] \033[1;31m<err> os: r0/a1: 0x00000000 r1/a2: 0x2000cfc0 r2/a3: 0x2000cfc0\033[0m
    [00:19:08.163,787] \033[1;31m<err> os: r3/a4: 0x200042ff r12/ip: 0x000000e2 r14/lr: 0x00010cff\033[0m
    [00:19:08.163,818] \033[1;31m<err> os: xpsr: 0x60000000\033[0m
    [00:19:08.163,818] \033[1;31m<err> os: Faulting instruction address (r15/pc): 0xeb699002\033[0m
    [00:19:08.163,818] \033[1;31m<err> os: >>> ZEPHYR FATAL ERROR 0: CPU exception on CPU 0\033[0m
    [00:19:08.163,818] \033[1;31m<err> os: Current thread: 0x20001f40 (sysworkq)\033[0m
    [00:19:09.107,147] \033[1;31m<err> os: Halting system\033[0m

    I have enabled the STACK_ANALYZER and I am attaching the stack analyzer logs from boot up to the "MPU FAULT" crash. Note, where you see the three dots (...)  is where I removed my application logs (LOG_DBG/INF/WRN/ERR) for readability.

    stack_analyzer_logs.txt

    Thank you

    Kind regards

    Mohamed

  • Hi Mohamed,

    The map file did not get uploaded. Anyway, the easiest way to try to rule out a stack overflow is often to try increasing the stack size, or have you tried that already? The sysworkq stack can be adjusted through the CONFIG_SYSTEM_WORKQUEUE_STACK_SIZE symbol.

    Kind regards,

    Vidar

Related