PPK2 and Power Profiler desktop: time scale way off

Did a quick search and it seems I am not the only one experiencing this issue Disappointed But can't find a solution.

I just got a PPK2 and started testing some devices (ESP8266). I quickly noticed that the time in the graphs was completely off.
Have a look at this screenshot:

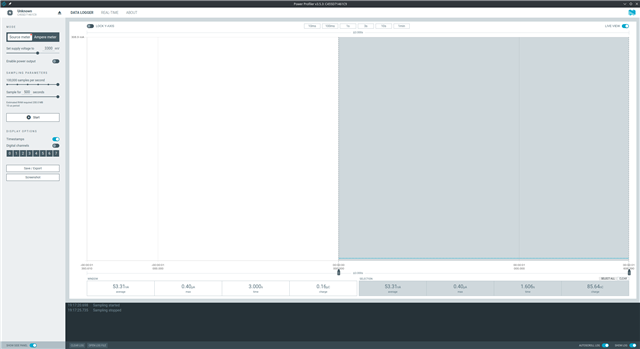
Without even activating the power supply, just starting measuring and stopping 5 seconds later. You can see down in the log:

19:17:20.698	Sampling started
19:17:25.735	Sampling stopped

But if I click on SELECT ALL it says 1.606 seconds
So basically it reports around 1 second for every 3 actual seconds.

It doesn't matter how many samples per second I take, it does it all the time.
Zooming doesn't change anything, it is still wrong.
Tried with 3 different USB ports already both USB2 and USB3, different cables too.
And the DUT I don't think it matters, tried a few already but same problem regardless.

Should I return the unit? Or is it a software error? Any workaround?

System:
Manjaro/KDE
Linux Kernel 6.0.15
AMD Ryzen 5 5600X
16GB RAM
MSI B450 Tomahawk Max II on latest BIOS: 7C02vH9 2022-08-15 (it was happening with a previous BIOS too)

Power Profiler v3.5.3

Edit: tried on windows, same problem.

Edit2: tried on an ancient Intel laptop, with windows, and it works fine. So it is not the hardware, it is the software that is broken. And has been broken for 2 years according to the reports: github.com/.../141

# nRFConnect System Report - 2023-01-20T21-32-39.794Z

- System:     Micro-Star International Co., Ltd MS-7C02
- BIOS:       American Megatrends International, LLC. H.90
- CPU:        1 x AMD Ryzen 5 5600X 6-Core Processor 3.7 GHz 12 cores (6 physical)
- Memory:     10.2 GB free of 15.5 GB total
- Filesystem: S.ficheros (Tipo) 0 Bytes NaN% used

- OS:         ManjaroLinux (22.0.0) linux x64

- Versions
    - kernel: 6.0.15-1-MANJARO
    - git: 2.39.0
    - node: 14.16.0
    - python: 3.10.8
    - python3: 3.10.8
    - nrf-device-lib-js: 0.4.13
    - nrf-device-lib: 0.12.8
    - nrfjprog DLL: Unknown
    - JLink: Unknown

- Connected devices:
    - C455D71461C9 : /dev/ttyACM0

- Current device:
    - name:          
    - serialNumber:  C455D71461C9
    - cores:         Unknown
    - website:       Unknown

  • I connected it to a USB3 hub and it works fine on my AMD machine.

    I have been experimenting with the python PPK2 API and discovered that just reading a fixed amount of bytes from the serial port takes longer when connected directly compared to the USB hub.

    When connected to the hub:

    Bus 003 Device 023: ID 1915:c00a Nordic Semiconductor ASA PPK2
    reading 8192 bytes took 21.00ms
    reading 8192 bytes took 20.00ms
    reading 8192 bytes took 21.00ms
    reading 8192 bytes took 20.00ms
    reading 8192 bytes took 22.00ms

    When connected directly to one USB port:

    Bus 001 Device 031: ID 1915:c00a Nordic Semiconductor ASA PPK2
    reading 8192 bytes took 64.00ms
    reading 8192 bytes took 64.00ms
    reading 8192 bytes took 64.00ms
    reading 8192 bytes took 64.00ms

    If a sample is 4 bytes this means that:

    • the hub is able to read 2048 samples every 20ish milliseconds. That is a rate of  ~100k samples per second. As expected.
    • when directly connected it reads 2048 samples per 64ms. That is a rate of 32k samples per second. That is only 32% of the theoretical sample rate.

    And if the timing on the graph relies on the 100k theoretical rate, when that rate is in reality only 32% then yeah, 5 seconds would look like only 32% of it, so 1.6 seconds.

    But why does reading take so much longer when connected to a USB port directly compared to having a USB hub in between?

  • Thank you for the detailed description.

    Seems you already found both the cause and workaround for the issuee. I will report this internally to our developers.

    TheBronx said:
    But why does reading take so much longer when connected to a USB port directly compared to having a USB hub in between?

    Not sure. I'll do some research as to why this happens.

    Br,
    Joakim

  • Have you tried on windows? Do you see the same issue there?

    Edit: Just saw that you mentioned windows in the original post.

  • I would be happy to try things and help debug this issue. But I have no experience writing drivers, and BIOS is black magic to me. So I am a bit clueless.

    On one hand I feel like it has to be possible to make the device work, on the other I feel like if it fails in windows and linux maybe the problem is deeper than the Power Profiler app (or any other app) can reach.

    I keep wondering one thing though: if there is some problem or limitation that makes the communication too slow, so measurements are lost, why does the problem happen at any sample rate? If I set it to 100k and I can only get 32k, well then anything below 32k should work fine right? But no.

    Of course I don't know what the protocol looks like, I only took the python API code and played with it a bit. But isn't it weird?

    BTW I think the app should show a clear and visible warning when the actual sample rate doesn't match the expected sample rate. And maybe collect statistics about how many times this warning is being triggered to see how widespread (or not) this problem might be. Cause I don't think my system is that uncommon. Maybe it is just this particular motherboard? Maybe it is all B450 chipsets? Maybe other AMD chipsets too? Maybe it happens in some Intel boards too who knows.

    And thank you for the answer Joakim. I think the product is pretty cool. I was very disappointed at first but after discovering the workaround I used it for quite some time and I like it, app is simple yet powerful, very nice!

  • TheBronx said:
    I keep wondering one thing though: if there is some problem or limitation that makes the communication too slow, so measurements are lost, why does the problem happen at any sample rate? If I set it to 100k and I can only get 32k, well then anything below 32k should work fine right? But no.

    The sampling rate is actually always 100kHz. When selecting anything below you will still have a sample rate of 100kHz but use an average filter.
    That is most likely the reason.

    TheBronx said:
    Maybe it is just this particular motherboard? Maybe it is all B450 chipsets? Maybe other AMD chipsets too? Maybe it happens in some Intel boards too who knows.

    Not really sure how widespread this problem is. I'll do some investigating and get back to you!

    Br,
    Joakim

Related