Using a debugger with nRF Connect

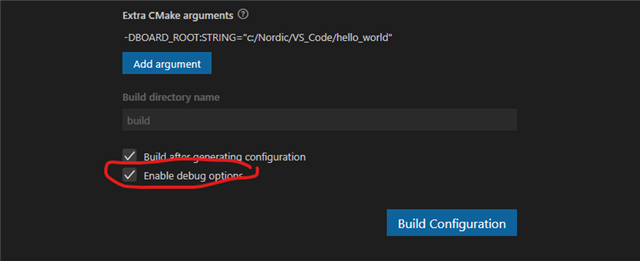
I'm looking to use a debugger with nRF Connect. So I'm starting with a build of the hello_world test for my nRF52 DK. I checked the box to "Enable debug options" and then create the build config:

Then, I use this config to do a pristine build of the hello_world app. But when I go back to look at the build configuration, the Enable debug box is unchecked!

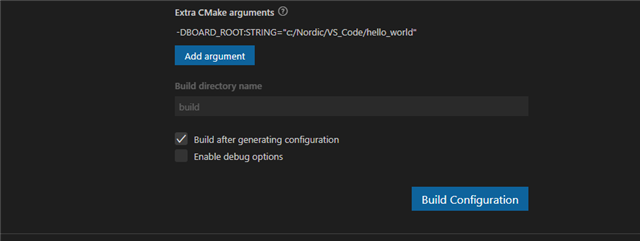
It unchecked itself during the build!

Next, I opened the main and put a breakpoint there:

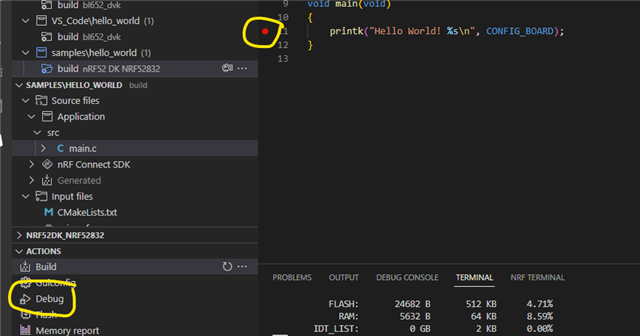
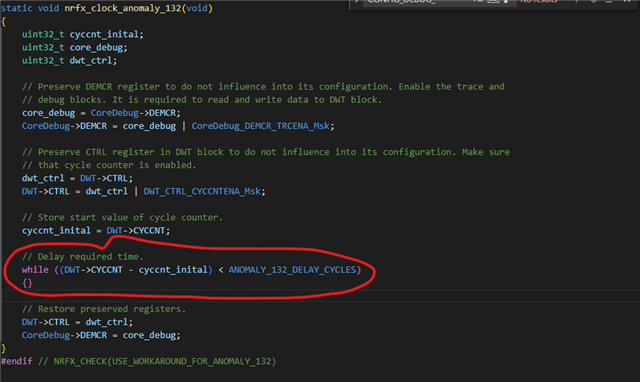
Then I hit the debug button to see if it would still work, despite the fact that the Debug options are off. And I get this - the debugger appears to choke in cpu_idle.s:

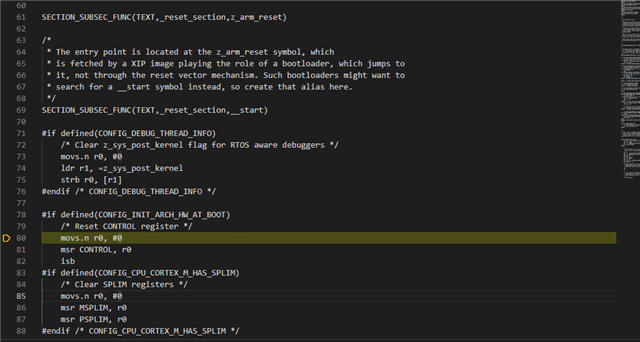
Here's the code, in case you want to search for fragments:

SECTION_SUBSEC_FUNC(TEXT,_reset_section,z_arm_reset)

/*
 * The entry point is located at the z_arm_reset symbol, which
 * is fetched by a XIP image playing the role of a bootloader, which jumps to
 * it, not through the reset vector mechanism. Such bootloaders might want to
 * search for a __start symbol instead, so create that alias here.
 */
SECTION_SUBSEC_FUNC(TEXT,_reset_section,__start)

#if defined(CONFIG_DEBUG_THREAD_INFO)
    /* Clear z_sys_post_kernel flag for RTOS aware debuggers */
    movs.n r0, #0
    ldr r1, =z_sys_post_kernel
    strb r0, [r1]
#endif /* CONFIG_DEBUG_THREAD_INFO */

#if defined(CONFIG_INIT_ARCH_HW_AT_BOOT)
    /* Reset CONTROL register */
    movs.n r0, #0
    msr CONTROL, r0
    isb

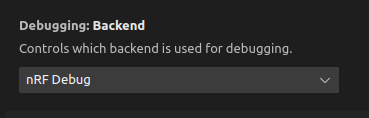
A little searching about debuggers for nRF Connect seems to indicate that there are several different tools. I'm just using whatever is there "out of the box". Should I be doing something else?

I'm not surprised that debugging is a little tricky with an RTOS. The main is probably not really the true execution entry point.

Are there any tutorials about debugging in nRF Connect?

  • Hi,

    Enable debug box is unchecked!

    This could be a bug in the VS Code extension. Enabling debug options will set the Kconfig options CONFIG_DEBUG_OPTIMIZATIONS and CONFIG_DEBUG_THREAD_INFO. So to check whether this is enabled, you can check the generated configurations. Go to hello_world/build/zephyr and open the .config file. The .config file is the file with generated configs, so search for CONFIG_DEBUG_OPTIMIZATIONS and CONFIG_DEBUG_THREAD_INFO there. If you get that they are =y, then debug options have been enabled successfully.

    You can still debug without these options enabled. CONFIG_DEBUG_OPTIMIZATIONS will optimize debugging, and CONFIG_DEBUG_THREAD_INFO enabled thread-aware debugging. However, this is unnecessary in a simple application such as hello world.

    And I get this - the debugger appears to choke in cpu_idle.s:

    This is not unexpected. After it stops there, you can click continue (F5), and it should continue the program and stop at your breakpoint.

    Should I be doing something else?

    The extension should use nRF Debug as debugging backend by default. You can check your settings to see what the extension is using in your case. In VS Code, go to Settings -> Extensions -> nRF Connect and look for the "Debugging: Backend" setting:

    Are there any tutorials about debugging in nRF Connect?

    We do have more information about debugging using the VS Code for nRF Connect SDK extension in the extension's documentation:

    Best regards,

    Marte

  • I checked the config file and both CONFIG_DEBUG_OPTIMIZATIONS and CONFIG_DEBUG_THREAD_INFO are set to y.

    Here's the next weird thing. When I try the same code with my target board (which has a 52810 using the internal clock) the code hangs in the following place:

    This looks like a workaround time delay for an LF clock startup issue. I think they intended this code to look like this:

    while ((DWT->CYCCNT - cyccnt_inital--) < ANOMALY_132_DELAY_CYCLES)

    But they left the decrement off of cyccnt_inital. Without the decrement, of course, this while loop spins forever and hangs my code.

    Can you confirm that this is a bug in the c-code? The file is C:\ncs\v2.2.0\modules\hal\nordic\nrfx\drivers\src\nrfx_clock.c

    And just to be sure, should the USE_WORKAROUND_FOR_ANOMALY_132 flag be set when using the 52810 and LF clock? If I can set this flag to 0 then the buggy code won't get included, of course. That would fix me up too.

  • Hi,

    The implementation of the workaround is correct.

    Bret Foreman said:
    When I try the same code with my target board (which has a 52810 using the internal clock)

    Have you made a custom board and custom board files, or are you programming your target board with the project built for nRF52 DK? Anomaly 132 ([132] CLOCK: The LFRC oscillator might not start) applies to nRF52832 and is not present in nRF52810. The nRF52810 does not have DWT, which explains why it hangs when you run it on your board with nRF52810.

    Best regards,

    Marte

  • Ah, I was using the board files for the bl652_dvk on the recommendation of the manufacturer, Laird. They said my 453 module was compatible. But that is not the case because the 652 uses the 52832 SoC and the 453 uses the 52810 SoC. It looks like Laird doesn't have a set of board files specifically for their 453 module so I'll need to make them.

  • I've created my own custom board on top of the nRF52810 SoC and I'm testing the hello_world app with that. I'll start a new ticket with those results.

Related