nRF9160 real network power profile

I trying to match the nrf9160DK current consumption measured with the "power Profiler kit II" with the "online power profiler".

I watched the nordic youtube video "How to power profile your cellular IoT application".

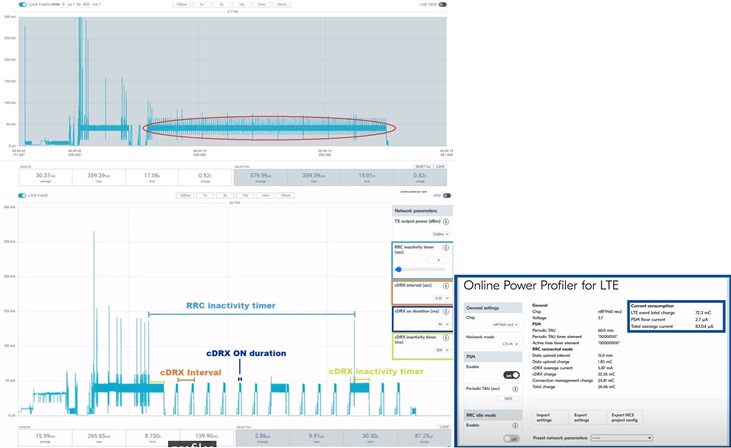
In the video a total average current of 83uA is archived for the UDP example.

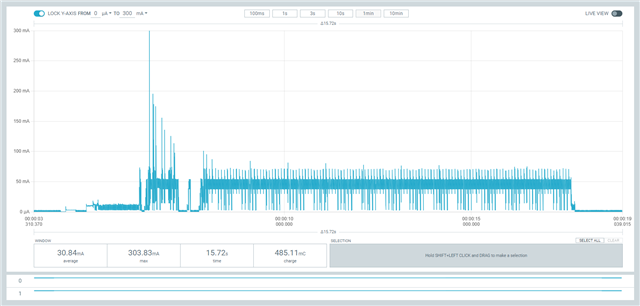
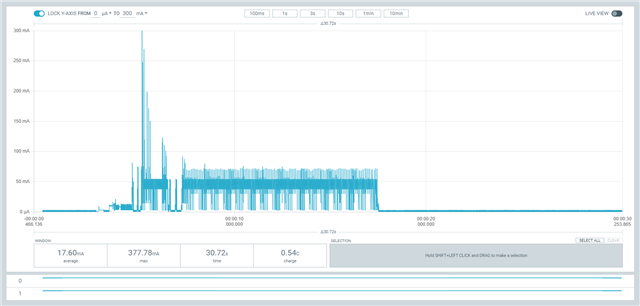
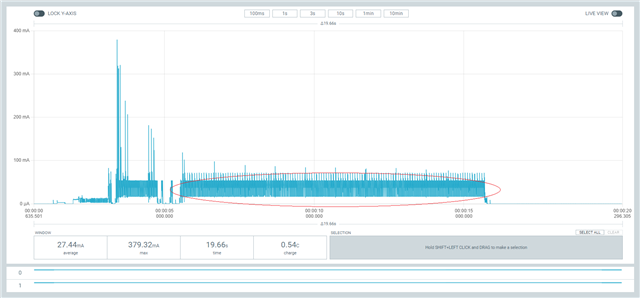
When I execute the same UDP example on the nrf9160DK I get a total average current of 579uA. See picture with the red circle.

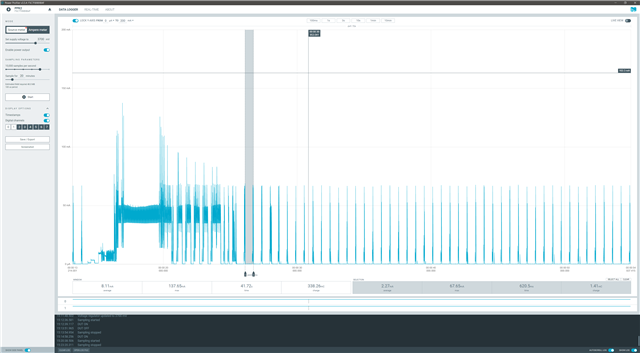
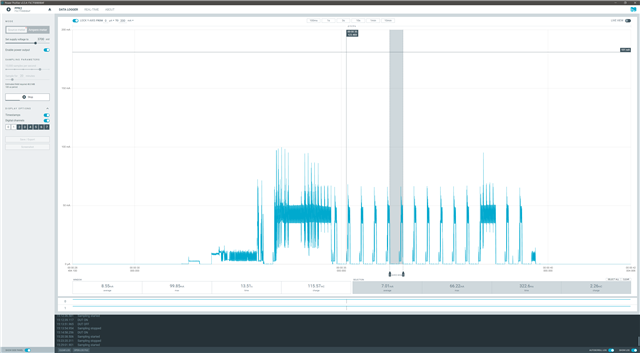
Maybe the difference is due the part within the red circle which is much longer than the "cDRX inactivity timer" from the video.

What is the name of the part within the red circle and how can I enter this part in the "online power profiler"?


nRF9160DK PCA10090 1.1.0

Modem firmware: mfw_nrf9160_1.3.4.zip

Measured PSM floor current: 3.73uA

NRF Connect SDK V2.2.0

Parents
  • Hello, 

    Are you able to provide any log output from the device during the measurements, along with a modem trace? This will tell us what is going on in the background. What SIM card are you using? What is you location?

    Note that there are several settings that differ from network to network, e.g. is the roaming SIM allowed on the network. 

    Thanks!

    Kind regards, 
    Øyvind

  • Hello, 

    Below you can find the log output and modem trace file.

    I'm using the IBASIS eSIM (I get simular results with a simpoint SIM)

    My location: The Netherlands, Drenthe, Emmen, 7812VA

    trace-2023-02-16T12-45-32.766Z.bin

    Kind regards, 

    Willem

  • Willem, 

    The modem trace and logs are too small. How long did you leave them running?

    Kind regards,
    Øyvind

  • For approximately the duration seen in the power profiler screenshot.

    I could open the trace file in the "Trace Collector V2 preview" and in wireshark.

  • Øyvind,

    I executed the modem trace and logs once more.

    Now the.bin file is a little bigger.

    I also included the log file found in the "logs" directory

    Hopefully it's now large enough.

    trace-2023-02-16T14-01-00.016Z.bin

    With best regards,

    Willem

  • Willem, 

    I'm not able to reproduce this on my side. What settings did you add in the Online Power Profiler?

    Here is my test with my iBasis (seemingly not getting PSM).

    And with my local SIM from Telia

Reply
  • Willem, 

    I'm not able to reproduce this on my side. What settings did you add in the Online Power Profiler?

    Here is my test with my iBasis (seemingly not getting PSM).

    And with my local SIM from Telia

Children
  • Øyvind,

    I didn't use settings from the Online Power Profiler.

    I executed the SDK V2.2.0 example "nrf/samples/nrf9160/udp" with the modifications "CONFIG_NRF_MODEM_LIB_TRACE=y" and "CONFIG_SERIAL=y". And I observed the large average current difference with the video.

  • Can you retry without CONFIG_SERIAL? 

  • Øyvind,

    I tried commenting out "CONFIG_SERIAL=y" in both "spm.conf" and "prj.conf" but in this case serial is still enabled and the long high power consumption part within the red circle is still there.
    I also tried setting "CONFIG_SERIAL=n" in both "spm.conf" and "prj.conf" in this case serial is disabled but the long high power consumption part within the red circle is still there.
    Below you find the trace file.
    Is there a way to enable more logging/debugging to find out what is happening within the red circle?

    trace-2023-02-17T08-28-50.475Z.bin

    Thanks for your reply in advance

    With best regards,

    Willem

  • Willem, I have forwarded this to our modem team and expect an answer by end of today or tomorrow. 

    -Øyvind

  • I've tried with three different SIM cards to have a comparison. Was your modem trace done with an iBasis SIM?