Hello,
I installed the SDK and the toolchain manually because I need to have multiple version of the SDK and everything works great from the terminal (build, flash).
I already used the extension with the SDK version 1.6.1 and the ARM GNU toolchain and everything worked as expected.
Now I would like to use the VS Code extension to debug my custom application with the SDK version 2.3.0 and the Zephyr toolchain and I have problem to debug the application as the extension does not find GDB. When I click on the "Debug" button I get the "Unable to find GDB in the installed toolchain".
The extension is configured to search for the toolchain in the PATH and when I open a terminal in VS Code I can see that arm-zephyr-* binaries are in the PATH.
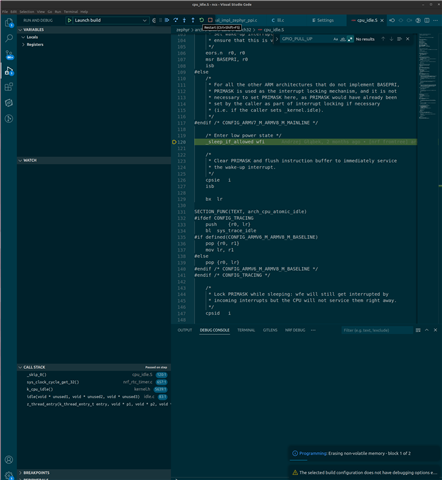
The only way I found to be able to debug is to click on "Configure debugging" and set the gdbPath manually in the launch.json file but then when I click on the "Reload" button it reflash the binary instead of restarting the application which is really unconvenient as I have to stop the current session and reflash to restart the session.
I am running SDk version 2.3.0 and extension version v2023.2.56.
You can find attached the generated support information.
Regards
IMPORTANT: The data below could contain sensitive or confidential information about your environment.
If you do not wish this to be seen by others, please make sure to remove it before sharing.

For help and support, visit the Nordic DevZone at https://devzone.nordicsemi.com/.

{
  "platform": {
    "os": "linux",
    "osVersion": "#63-Ubuntu SMP Fri Dec 16 14:32:59 UTC 2022",
    "osKernel": "5.14.0-1056-oem",
    "vscode": "1.76.2",
    "electron": "19.1.11",
    "node": "v16.14.2"
  },
  "system": {
    "date": "2023-03-26T14:29:11.068Z",
    "vscodeRoot": "/usr/share/code/resources/app",
    "nrfConnectForDesktopInstalled": "unknown",
    "vscodeUptime": "00:14:01",
    "osUptime": "1397:55:41",
    "cpu": {
      "model": "11th Gen Intel(R) Core(TM) i7-1185G7 @ 3.00GHz",
      "speed": "1800 MHz",
      "count": 4
    },
    "memory": {
      "total": "15.37 GB",
      "free": "3.66 GB"
    }
  },
  "workspace": {
    "name": "nrf9160",
    "workspaceFile": null,
    "folders": [
      "/home/alexandre/Documents/Dev/<redacted>"
    ]
  },
  "extensions": {
    "internal": {
      "nordic-semiconductor.nrf-connect": {
        "version": "2023.2.56",
        "path": "/home/alexandre/.vscode/extensions/nordic-semiconductor.nrf-connect-2023.2.56-linux-x64",
        "isActive": true
      },
      "nordic-semiconductor.nrf-terminal": {
        "version": "2022.11.29",
        "path": "/home/alexandre/.vscode/extensions/nordic-semiconductor.nrf-terminal-2022.11.29",
        "isActive": true
      },
      "nordic-semiconductor.nrf-devicetree": {
        "version": "2022.11.153",
        "path": "/home/alexandre/.vscode/extensions/nordic-semiconductor.nrf-devicetree-2022.11.153",
        "isActive": true
      },
      "nordic-semiconductor.nrf-kconfig": {
        "version": "2022.11.50",
        "path": "/home/alexandre/.vscode/extensions/nordic-semiconductor.nrf-kconfig-2022.11.50",
        "isActive": true
      }
    },
    "external": {
      "marus25.cortex-debug": "1.10.0",
      "ms-vscode.cpptools": "1.14.5",
      "ms-vscode.js-debug": "1.76.1",
      "ms-vscode.js-debug-companion": "1.0.18",
      "ms-vscode.vscode-js-profile-table": "1.0.3",
      "cschlosser.doxdocgen": "1.4.0",
      "dan-c-underwood.arm": "1.7.4",
      "eamodio.gitlens": "13.4.0",
      "GitLab.gitlab-workflow": "3.60.0",
      "jeff-hykin.better-cpp-syntax": "1.17.2",
      "josetr.cmake-language-support-vscode": "0.0.9",
      "mathiasfrohlich.Kotlin": "1.7.1",
      "mcu-debug.debug-tracker-vscode": "0.0.15",
      "mcu-debug.memory-view": "0.0.20",
      "mcu-debug.rtos-views": "0.0.6",
      "mhutchie.git-graph": "1.30.0",
      "ms-azuretools.vscode-docker": "1.24.0",
      "ms-dotnettools.vscode-dotnet-runtime": "1.6.0",
      "ms-python.isort": "2022.8.0",
      "ms-python.python": "2023.4.1",
      "ms-python.vscode-pylance": "2023.3.30",
      "ms-vscode-remote.remote-containers": "0.282.0",
      "ms-vscode-remote.remote-ssh": "0.98.0",
      "ms-vscode-remote.remote-ssh-edit": "0.84.0",
      "ms-vscode-remote.remote-wsl": "0.76.1",
      "ms-vscode.cpptools-extension-pack": "1.3.0",
      "ms-vscode.cpptools-themes": "2.0.0",
      "ms-vscode.hexeditor": "1.9.11",
      "ms-vscode.remote-explorer": "0.2.0",
      "trond-snekvik.gnu-mapfiles": "1.1.0",
      "zxh404.vscode-proto3": "0.5.5"
    }
  },
  "tools": {
    "/home/alexandre/Documents/Dev/Tools/nRF_Connect_SDK_2.3.0/opt/zephyr-sdk-0.15.2/arm-zephyr-eabi/bin/arm-zephyr-eabi-gcc": "0.15.2",
    "/opt/SEGGER/JLink/JLinkExe": "7.66g",
    "/usr/local/bin/nrfjprog": "10.15.3",
    "nrfutil": "Not found",
    "/usr/bin/cmake": "3.26.0",
    "/home/alexandre/Documents/Dev/Tools/nRF_Connect_SDK_2.3.0/venv/bin/west": "1.0.0",
    "/home/alexandre/Documents/Dev/Tools/nRF_Connect_SDK_2.3.0/venv/bin/python3": "3.8.10",
    "/usr/bin/ninja": "1.10.0",
    "/usr/bin/gperf": "3.1",
    "/usr/bin/dtc": "1.5.0",
    "gn": "Not found",
    "/usr/bin/git": "2.40.0",
    "gdbPath": "GDB path not found"
  },
  "sdks": [
    {
      "version": "1.9.1",
      "path": "/home/alexandre/Documents/Dev/Tools/nRF_Connect_SDK_1.9.1/opt/ncs"
    },
    {
      "version": "2.3.0",
      "path": "/home/alexandre/Documents/Dev/Tools/nRF_Connect_SDK_2.3.0/opt/ncs"
    },
    {
      "version": "1.6.1",
      "path": "/home/alexandre/Documents/Dev/Tools/nRF_Connect_SDK_1.6.1/opt/ncs"
    },
    {
      "version": "2.0.0",
      "path": "/home/alexandre/Documents/Dev/Tools/nRF_Connect_SDK/opt/ncs"
    }
  ],
  "toolchains": [],
  "connectedDevices": [
    {
      "serialNumber": "<redacted>"
    }
  ],
  "deviceProviders": [
    "nrfjprog"
  ],
  "config": {
    "nordic-semiconductor.nrf-connect": {
      "topdir": "${nrf-connect.sdk:2.3.0}",
      "toolchain": {
        "path": "PATH"
      },
      "ozonePath": "",
      "applications": [
        "${workspaceFolder}"
      ],
      "applicationOptions": {},
      "kconfig": {
        "interface": "kconfig",
        "executeInDefaultShell": false
      },
      "welcome": {
        "showOnStartup": false
      },
      "west": {
        "env": {
          "$base": "terminal"
        }
      },
      "boardRoots": [],
      "enableTelemetry": false,
      "taskBindings": {},
      "debugging": {
        "backend": "nRF Debug",
        "flash": true,
        "bindings": {
          "${workspaceFolder}/build": "Launch build"
        }
      },
      "activeAppFollowActiveEditor": true
    },
    "nordic-semiconductor.nrf-terminal": {
      "terminalMode": "character",
      "scrollBack": 1000
    },
    "marus25.cortex-debug": {
      "armToolchainPath": null,
      "armToolchainPrefix": "arm-zephyr-eabi",
      "gdbPath": null,
      "objdumpPath": null,
      "JLinkGDBServerPath": null,
      "openocdPath": null,
      "pyocdPath": null,
      "PEGDBServerPath": null,
      "stutilPath": null,
      "stlinkPath": null,
      "stm32cubeprogrammer": null,
      "enableTelemetry": true,
      "registerUseNaturalFormat": true,
      "variableUseNaturalFormat": true,
      "dbgServerLogfile": null,
      "showDevDebugOutput": "none"
    }
  },
  "environment": {
    "westExe": "west",
    "westEnv": {
      "ELECTRON_RUN_AS_NODE": "1",
      "HOME": "/home/alexandre",
      "PATH": "/home/alexandre/Documents/Dev/Tools/nRF_Connect_SDK_2.3.0/opt/ncs/zephyr/scripts:/home/alexandre/Documents/Dev/Tools/nRF_Connect_SDK_2.3.0/venv/bin:/home/alexandre/Documents/Dev/Tools/nRF_Connect_SDK_2.3.0/opt/zephyr-sdk-0.15.2/arm-zephyr-eabi/bin:/home/alexandre/.local/bin:/usr/local/sbin:/usr/local/bin:/usr/sbin:/usr/bin:/sbin:/bin:/usr/games:/usr/local/games:/snap/bin:/home/alexandre/bin:/home/alexandre/.local/bin",
      "ZEPHYR_BASE": "/home/alexandre/Documents/Dev/Tools/nRF_Connect_SDK_2.3.0/opt/ncs/zephyr",
      "ZEPHYR_TOOLCHAIN_VARIANT": "zephyr",
      "USER": "alexandre"
    },
    "inherited": {
      "ELECTRON_RUN_AS_NODE": "1",
      "HOME": "/home/alexandre",
      "PATH": "/home/alexandre/Documents/Dev/Tools/nRF_Connect_SDK_2.3.0/opt/ncs/zephyr/scripts:/home/alexandre/Documents/Dev/Tools/nRF_Connect_SDK_2.3.0/venv/bin:/home/alexandre/Documents/Dev/Tools/nRF_Connect_SDK_2.3.0/opt/zephyr-sdk-0.15.2/arm-zephyr-eabi/bin:/home/alexandre/.local/bin:/usr/local/sbin:/usr/local/bin:/usr/sbin:/usr/bin:/sbin:/bin:/usr/games:/usr/local/games:/snap/bin:/home/alexandre/bin:/home/alexandre/.local/bin",
      "ZEPHYR_BASE": "/home/alexandre/Documents/Dev/Tools/nRF_Connect_SDK_2.3.0/opt/ncs/zephyr",
      "ZEPHYR_TOOLCHAIN_VARIANT": "zephyr",
      "USER": "alexandre"
    },
    "toolchainPath": "PATH"
  },
  "terminal": {
    "shell": null,
    "defaultProfile": null
  }
}


