ble, lvgl, the prj.conf and RAM' overflowed by 3068 bytes error

I got a "Hello World" up and running with lvgl and modified the prj.conf to get the font I wanted. I folded in ble and now I am getting region `RAM' overflowed by 3068 bytes error when building. The board is a PineTime DK (nRF52932).

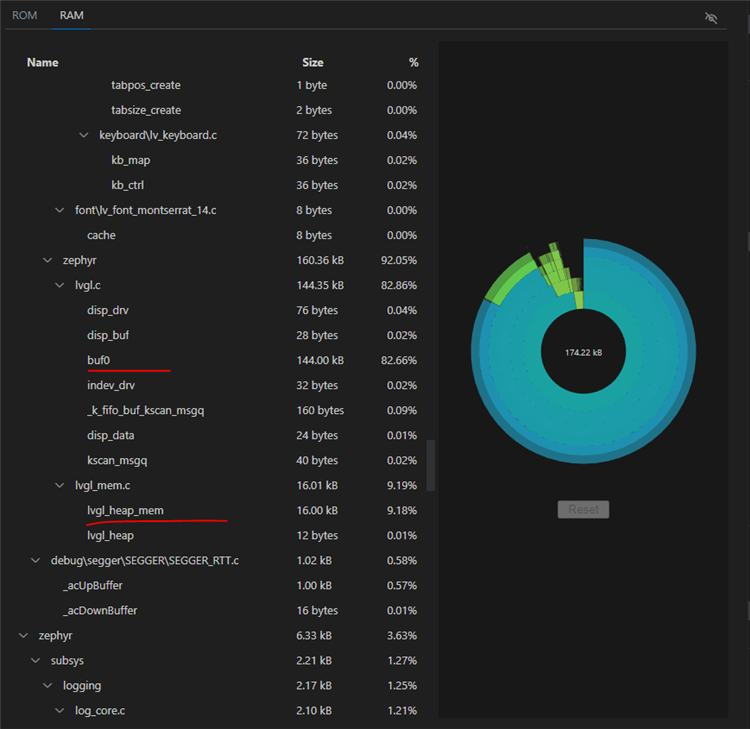
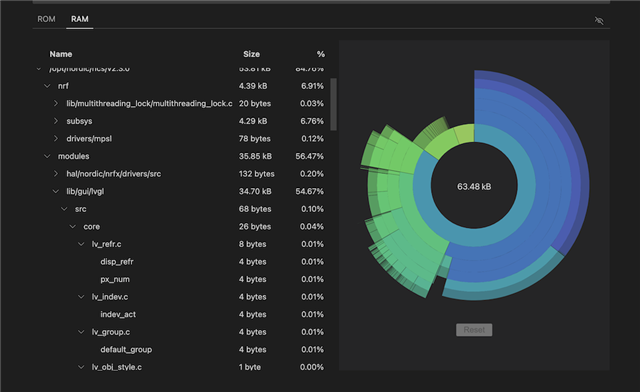
I am new at this and need to learn about the all the components and how they contribute to RAM, but these are only two components.

I can't tell what is driving the RAM usage, but I do see a lot of logging from lvgl like:

[373/427] Building C object modules/lvgl/CMakeFiles/..__modules__lib__gui__lvgl__zephyr.dir/opt/nordic/ncs/v2.3.0/modules/lib/gui/lvgl/src/extra/widgets/tabview/lv_tabview.c.obj

which I am not using.

It seems like the prj.conf is key to what gets included. Here is mine:

# nothing here
CONFIG_LV_Z_MEM_POOL_NUMBER_BLOCKS=8
CONFIG_MAIN_STACK_SIZE=2048
#CONFIG_SYSTEM_WORKQUEUE_STACK_SIZE=2048


# Display
CONFIG_SPI=y
CONFIG_DISPLAY=y
CONFIG_ST7789V=y
CONFIG_ST7789V_RGB565=y
CONFIG_DISPLAY_LOG_LEVEL_ERR=y

CONFIG_LV_CONF_MINIMAL=y
CONFIG_LOG=y
CONFIG_LVGL=y
CONFIG_LV_MEM_CUSTOM=y
CONFIG_LV_USE_LOG=y
CONFIG_LV_USE_LABEL=y
CONFIG_LV_USE_BTN=y
CONFIG_LV_USE_IMG=y
CONFIG_LV_FONT_MONTSERRAT_24=y
CONFIG_LV_FONT_DEFAULT_MONTSERRAT_24=y
#CONFIG_LVGL_DISPLAY_DEV_NAME="DISPLAY"

#CONFIG_ST7789V=y
CONFIG_USE_SEGGER_RTT=y

# Ble
CONFIG_BT=y
CONFIG_BT_DEBUG_LOG=y
CONFIG_BT_SMP=y
CONFIG_BT_SIGNING=y
CONFIG_BT_PERIPHERAL=y
CONFIG_BT_DIS=y
CONFIG_BT_ATT_PREPARE_COUNT=5
CONFIG_BT_BAS=y
#CONFIG_BT_HRS=y
#CONFIG_BT_IAS=y
CONFIG_BT_PRIVACY=y
CONFIG_BT_DEVICE_NAME="Test BLE Service"
CONFIG_BT_DEVICE_APPEARANCE=833
CONFIG_BT_DEVICE_NAME_DYNAMIC=y
CONFIG_BT_DEVICE_NAME_MAX=65

CONFIG_BT_KEYS_OVERWRITE_OLDEST=y
CONFIG_BT_SETTINGS=y
CONFIG_FLASH=y
CONFIG_FLASH_PAGE_LAYOUT=y
CONFIG_FLASH_MAP=y
CONFIG_NVS=y
CONFIG_SETTINGS=y

There doesn't seem to be much documentation about lvgl on Zephyr for lvgl 8.3:
Zephyr — LVGL documentation

I added this to the prj.conf:

CONFIG_LV_USE_CALENDAR=n

And still see this in the terminal when building:


[171/427] Building C object modules/lvgl/CMakeFiles/..__modules__lib__gui__lvgl__zephyr.dir/opt/nordic/ncs/v2.3.0/modules/lib/gui/lvgl/src/extra/widgets/calendar/lv_calendar.c.obj

Parents
  • Hi Leo

    A very good tool to analyze RAM and ROM consumption in a Zephyr application is the Memory Report feature in the nRF Connect VSCode extension. 

    This provides a detailed overview of exactly which variables and modules are consuming how much memory, including a graphical representation of the various modules and how much they use:

    In the example above I built the LVGL basic sample for the Adafruit 2.8" TFT display on the nRF52840DK. 

    The total RAM consumption is 178016 bytes, and from the memory report I can see clearly that most of this is caused by the LVGL display buffer (buf0) and the LVGL heap (lvgl_heap_mem). 

    The size of the LVGL heap can be reduced by reducing CONFIG_LV_Z_MEM_POOL_NUMBER_BLOCKS, which is set to 8 in the sample. 

    The size of the buffer can be reduced by reducing CONFIG_LV_Z_VDB_SIZE, which is a percentage value between 1 and 100 scaling the image buffer to the size of the screen. 

    I assume smaller values will lead to higher CPU usage and slower screen updates, but will reduce RAM consumption. 

    Best regards
    Torbjørn 

Reply
  • Hi Leo

    A very good tool to analyze RAM and ROM consumption in a Zephyr application is the Memory Report feature in the nRF Connect VSCode extension. 

    This provides a detailed overview of exactly which variables and modules are consuming how much memory, including a graphical representation of the various modules and how much they use:

    In the example above I built the LVGL basic sample for the Adafruit 2.8" TFT display on the nRF52840DK. 

    The total RAM consumption is 178016 bytes, and from the memory report I can see clearly that most of this is caused by the LVGL display buffer (buf0) and the LVGL heap (lvgl_heap_mem). 

    The size of the LVGL heap can be reduced by reducing CONFIG_LV_Z_MEM_POOL_NUMBER_BLOCKS, which is set to 8 in the sample. 

    The size of the buffer can be reduced by reducing CONFIG_LV_Z_VDB_SIZE, which is a percentage value between 1 and 100 scaling the image buffer to the size of the screen. 

    I assume smaller values will lead to higher CPU usage and slower screen updates, but will reduce RAM consumption. 

    Best regards
    Torbjørn 

Children
Related