
UPDATE MAY 2021:
Please follow the official documentation in infocenter.
The following information is deprecated, please follow the documentation link at the top.
Trace Collector app collects UART traces from the nRF91, over serial port. User can collect traces with this tool and send the trace files(binary) to Nordic for parsing and processing. In addition to the log file of the Link Monitor( you can get it clicking ‘Open Log File in the bottom part of the window in the Link Monitor), this modem trace is really useful, especially to analyze communication between UE and eNB. In this blog, I introduce the way how to turn on the modem trace. This blog is mainly on nRF91DK, but if you want get it on Thingy:91, please refer to the comment in "green color" below.
To use the "Trace Collector" there are some conditions to think through:
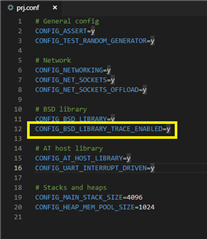
1. Have an app that has modem trace enabled (route modem data to second UART), add:
CONFIG_BSD_LIBRARY_TRACE_ENABLED=y in prj.conf and then build. (only for NCS versions older than v1.5.0)
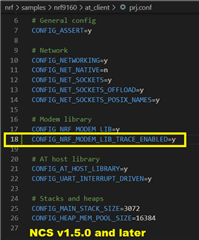
or if using NCS v1.5.0 or later
CONFIG_NRF_MODEM_LIB_TRACE_ENABLED=y in prj.conf and then build.
(The name of .conf file might be different. For example, in case of asset_tracker for Thingy:91, the correct file is prj_thingy91_nrf9160ns.conf.)
In this blog, I used the at_client sample built on my laptop with the option,
which is attached so that you can use this binary just for your simple test.*
2. Ensure proper board control (nRF52) to set up that second UART is connected to modem.
This board controller f/w can be downloaded here.
Please make sure SW5 to nRF52 before programming and switch back to nRF91 after flashing.
To program it, you can simply do it with below command in your console window.**
nrfjprog --program nRF9160_DK_board_controller_FW.hex --sectorerase -f nrf52 -r --verify
(In case of Thingy:91, connectivity_bridge should be used, which is included in precompiled application and modem firmware.)
3. program the trace-enabled application binary to the DK(or Thingy:91).
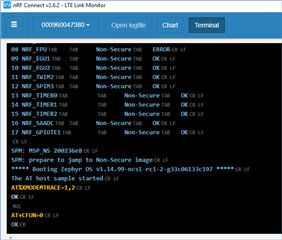
4. Send AT%XMODEMTRACE=1,2 to trigger.
And then AT+CFUN=0 to the modem to make it remain that state after a power cycle.
This means once it’s done, you don’t have to set it again.
(This step can be skipped, because it is automatically enabled in lte_lc.c lately, if CONFIG_BSD_LIBRARY_TRACE_ENABLED is defined in configuration file.
Please search the definition in lte_lc.c for detail.)
5. Get the board boot up (press reset to boot zephyr) and see if your application is working.
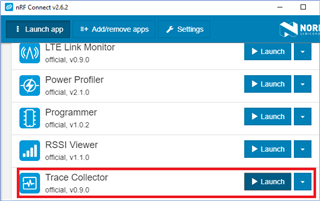
6. Run the Trace Collector app in the [Launch app] menu on the left-top side of the Link Monitor
and then set the device port.
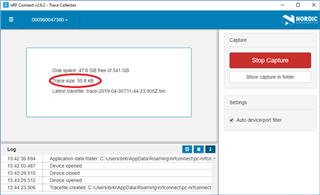
- To capture the log, push the ‘Start Capture’ button.
(if it works correctly, you will see the size of the trace will be increasing as following.)
8. Once you captured what you intended,
you can stop and the log file will be shown when you push [Show capture in folder].
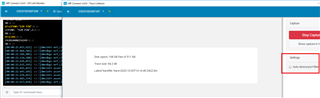
9. As for Thingy:91, we recommend you to uncheck "Auto device/port filter", not to be confused and then you won't miss it as below:
In short, when log analysis is required by Nordic, below information and files are essential to be analyzed.
- The mfw(modem f/w version) information.
- Serial log file saved in Link Monitor.(*.txt)
- Modem trace captured by Trace Collector. (trace*.bin)
- nRF91 DK or Thingy:91 version(if you used)
Feel free to ask any questions if it doesn't work well on your side and I will check and update.
(updated on end of October,2020.)
-

KMK
-
Cancel
-
Vote Up
0
Vote Down
-
-
More
-
Cancel
Comment-

KMK
-
Cancel
-
Vote Up
0
Vote Down
-
-
More
-
Cancel
Children