This tutorial will take less than 15 minutes.
#Motivation Never lose a BLE connection when debugging your applications again! This technique will also be useful for any application using the PWM peripheral and many others as well!
Monitor mode debugging can only be done on nRF52 series devices. It will not work with nRF51 series devices as Cortex-M0 doesn't support this feature.
#Intro
In the last blog post https://devzone.nordicsemi.com/blogs/825/segger-embedded-studio-cross-platform-ide-w-no-cod/ we introduced you to SEGGER Embedded Studio (SES). Please at least skim through that post if you haven't already.
In this post we will explore SES more and experiment with Monitor Mode Debugging (MMD) https://www.segger.com/monitor-mode-debugging.html. MMD allows you to halt the CPU while debugging (breakpoints, pausing execution) but still service interrupts with priority. Some use cases of this are: a BLE application can maintain its connection, a PWM can continue to operate a motor, a sensor can be read and its interrupt cleared so it can continue collecting data, etc... while the CPU is halted in debugging. There are many use cases, but at least most of us have experienced losing BLE connections while debugging and ending up in a hardfault/error handler when we continue code execution.
#Getting Started If you haven't already installed SES please look at the blog linked in the beginning of this post and follow the simple instructions to get it up and running.
Download this zip file, extract it, and open the SES project file. nRF5x-MMD-led-btn-example.zip
#Compiling and Running Only some very slight modifications are needed to run this example.
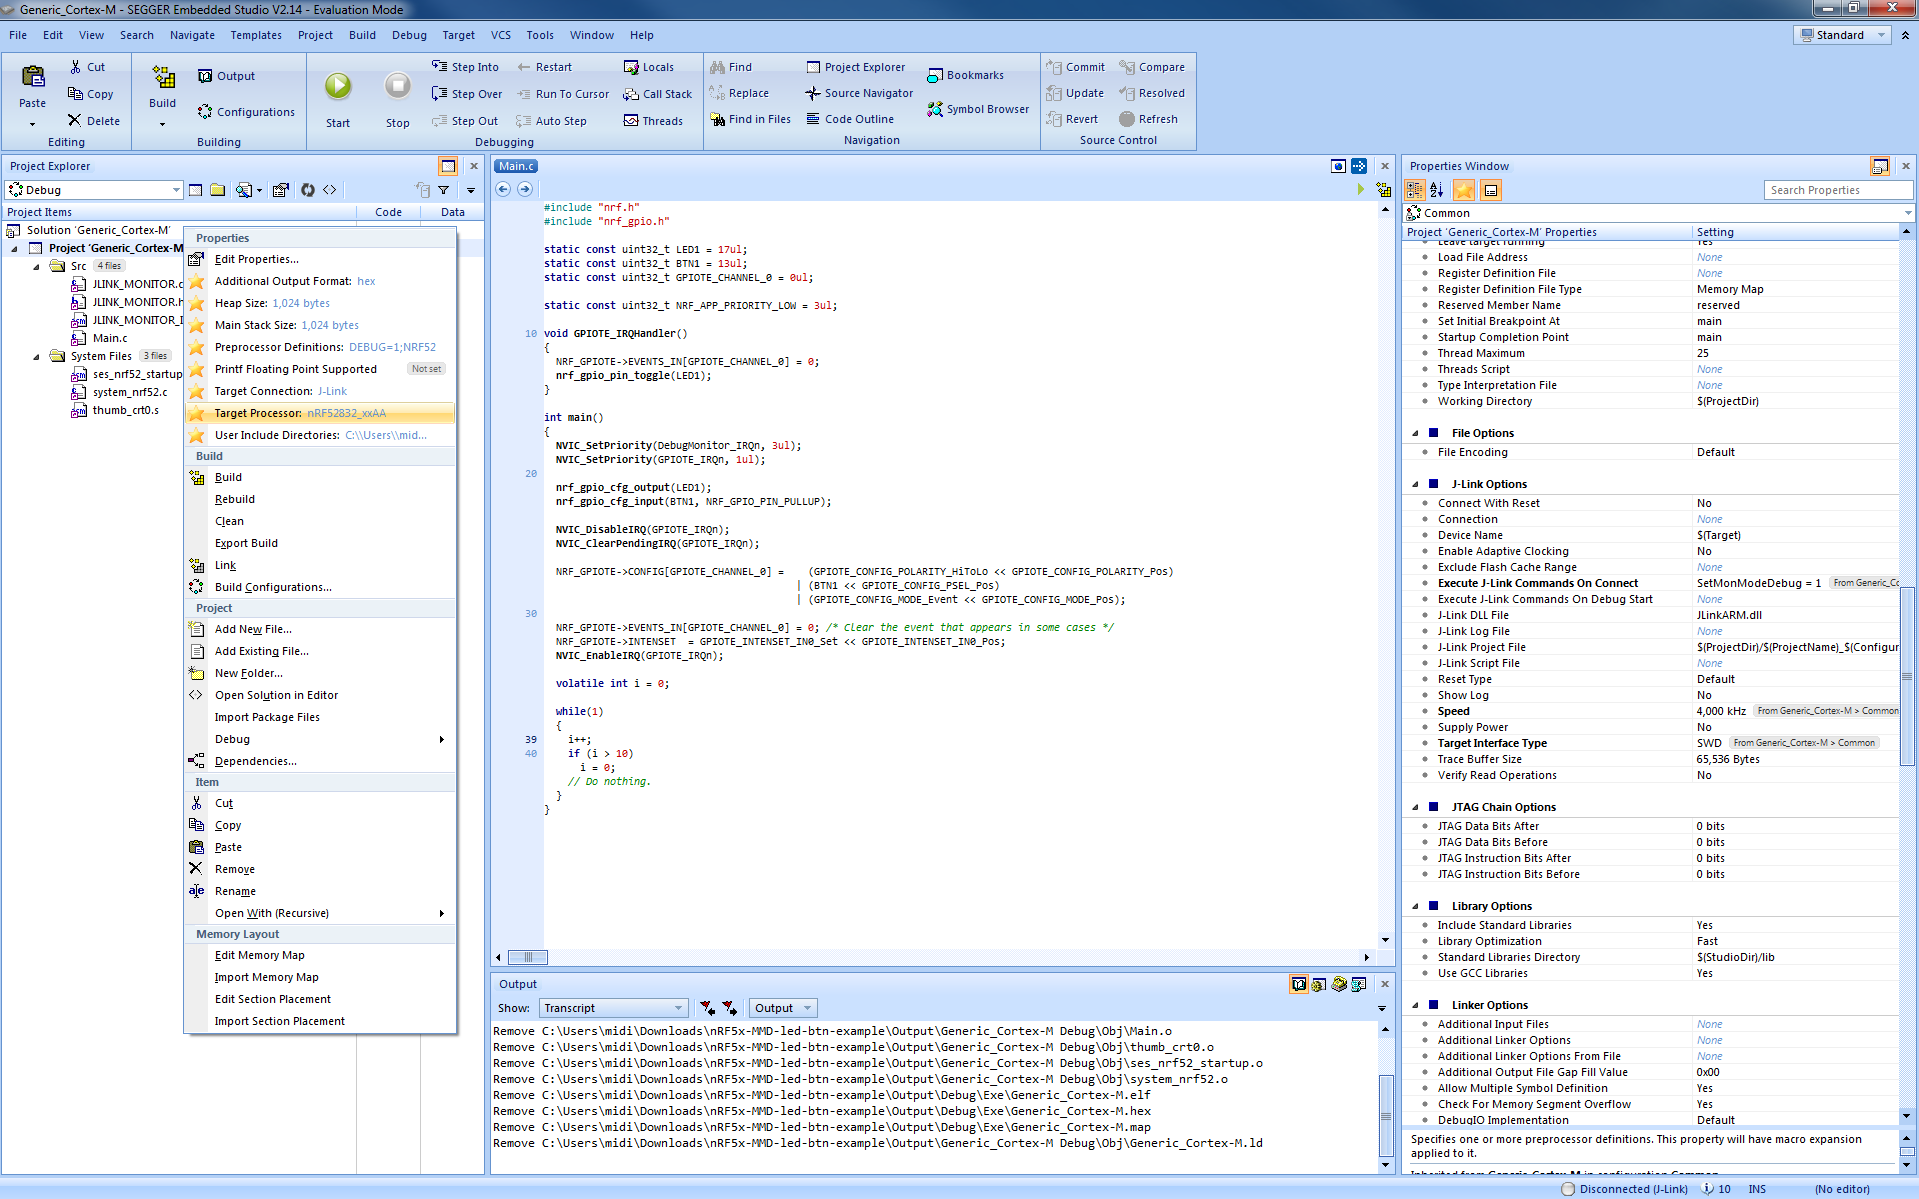
- Right click "Project 'Generic_Cortex_M'." This will open a window that allows you to edit the project properties and also shows the most common project properties that will need to be modified. Click "User Include Directories" and change these absolute paths to be correct for your system. For this project to compile the paths 'components\toolchain\gcc,' 'components\toolchain,' and 'components\drivers_nrf\hal' will need to be included in your project.
This is what your project should look like. 
Now under the "Build" tab at the top of the screen select "Build and Debug." Or you can just press the green play button "Start."
#Monitor Mode Debugging Now run the example. Press Button 1 and LED1 will toggle on your board. At the top of main.c you may have to change the pins the led & button are assigned to based on the board you are using. Now pause the execution. Press Button 1 and LED1 will still be toggled! Or set a break point in the while loop and notice the LED still toggles.
#How to make MMD work in any application
- Add the monitor mode debug files to your project (JLINK_MONITOR_ISR_SES.s, JLINK_MONITOR.c,h).
- Make sure 'DebugMon_Handler' system interrupt is defined in your startup file after 'SVC_HANDLER.'
- In project properties under "Debugger -> J-Link Options" enter the command 'SetMonModeDebug = 1' in the "Execute J-Link Commands on Connect." This tells the J-Link FW running on the development kit MMD will be used.
- At the top of main.c add ' NVIC_SetPriority(DebugMonitor_IRQn, 3ul);' to be the lowest priority possible (3 on nRF51, 7 on nRF52).
Monitor Mode Debugging is supported in SEGGER Embedded Studio, Keil uVision and IAR. A different JLINK_MONITOR_ISR_xxx.s file is needed for Keil and IAR.
#Where to go from here We would like to know what you think about monitor mode debugging. Please let us know in the comments and how you would like to use it. A tutorial on using MMD with a BLE application is planned and in the works.
#Notes
- You can find more info about monitor mode debugging in your SEGGER folder. Go to the most recent J-Link Software & Documentation pack "C:\Program Files (x86)\SEGGER\JLink_V510h" and see J-Link User Guide in the Manuals folder. This will have a chapter on MMD with info. about getting it working in Keil, IAR as well as SES.
More blog posts on the Toolchain are coming your way. What would you like to see? Some planned posts include:
- Bench marking code size and Coremark on nRF51 & nRF52 with the armcc, IAR, GCC and LLVM compilers.
- Designing custom PCBs for an optimal development experience.
- Automated testing and builds.
- Production programming guide (how to program 100 all the way to over 1,000,000 nRF5x devices in production).


-

awneil
-
Cancel
-
Vote Up
0
Vote Down
-
-
Sign in to reply
-
More
-
Cancel
Comment-

awneil
-
Cancel
-
Vote Up
0
Vote Down
-
-
Sign in to reply
-
More
-
Cancel
Children