Thingy91 light sensor data presentation in nrf cloud

Trying to make Thingy91's asset_tracker_v2 light sensor (BH1749) data to show up in a card on Dashboard in nrfcloud.

By default asset_tracker_v2 code supporting light sensor reports it as
#define APP_ID_LIGHT_THRESHOLD "LIGHT_THRESHOLD_EXCEEDED"

But since there is no card for LIGHT_THRESHOLD_EXCEEDED
we changed it to 
#define APP_ID_LIGHT_THRESHOLD "LIGHT"

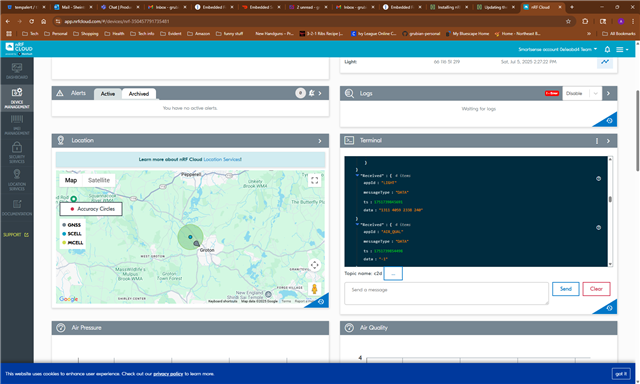
After this change - data shows up in LIGHT card, but only the event count (see attached screenshots).
We would like to see chart of timestamped R/G/B/IR datapoints,

Hence the question - how do we make it show up as a chart of datapoints with timestamps ?
Parents
  • Hey there- I am currently looking into this to see what is possible. I should have an update for you in the next day or so.

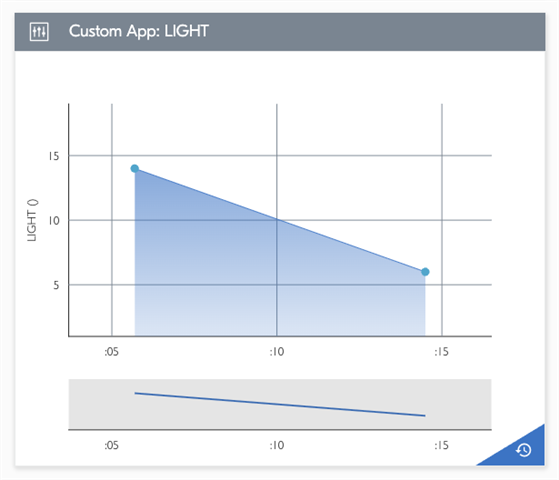
  • The custom app cards will only show very basic numeric data points:


    The example above is populated with a data array like:

    const data = [
      {
        appId: "LIGHT",
        messageType: "DATA",
        ts: 1751739854498,
        data: "6"
      },
      {
        appId: "LIGHT",
        messageType: "DATA",
        ts: 1751739845691,
        data: "14"
      }
    ]

    In the example you posted there are single and array based data points. This will not translate to how these custom cards work. You could try to create four different cards with an R / G / B / IR value on each card, but I'm pretty sure this is not what you're looking for. If you are trying to show whether any R/G/B/IR value exceeded a threshold, I think you would need to send it as a boolean like 0 or 1, but again, with four values I'm not sure this would be ideal as it would require 4 different cards. As of right now the display you are looking for is not supported.
Reply
  • The custom app cards will only show very basic numeric data points:


    The example above is populated with a data array like:

    const data = [
      {
        appId: "LIGHT",
        messageType: "DATA",
        ts: 1751739854498,
        data: "6"
      },
      {
        appId: "LIGHT",
        messageType: "DATA",
        ts: 1751739845691,
        data: "14"
      }
    ]

    In the example you posted there are single and array based data points. This will not translate to how these custom cards work. You could try to create four different cards with an R / G / B / IR value on each card, but I'm pretty sure this is not what you're looking for. If you are trying to show whether any R/G/B/IR value exceeded a threshold, I think you would need to send it as a boolean like 0 or 1, but again, with four values I'm not sure this would be ideal as it would require 4 different cards. As of right now the display you are looking for is not supported.
Children
  • Thank you for detailed reply.
    We'll need to figure out how we want to proceed.
    For my reference (I'm very new to nrf cloud) - how would I go about creating these new custom cards ?
    I understand that I need separate appIds fior each
    Let's say we decide to have LIGHT_R, LIGHT_G, LIGHT_B and LIGHT_IR, and we can decide later whther we want the actual value at the time of the trigger (when threshold is crossed) or just 0/1 to indicate the fact of exceeding threshold.
    Is there anything that needs to be done on nrf cloud side to define these new custom cards ?

Related