Thingy:91 stopped showing NAS debug trace

We have a Thingy:91 (nRF9160) that we use for various LTE-M / NB-IoT network debugging. 

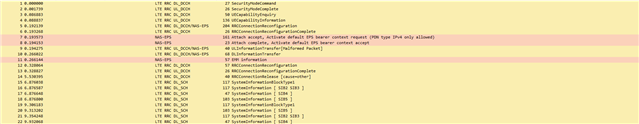
Until recently I was able to see both RRC and NAS messages in both "Cellular Monitor" app and when set to pipe directly to Wireshark. However, since rencently I can no longer see any NAS messages.


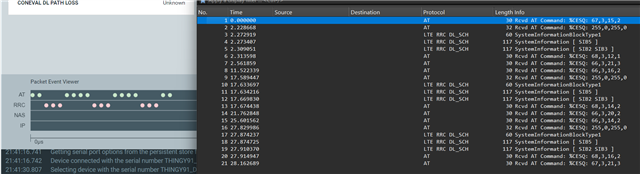
Reading various docs (AT command reference and searching Nordics online) on using AT%XMODEMTRACE, I tried several of the documented trace settings. For example, in the manual you say to use: 

AT%XMODEMTRACE=<oper>[,<set_id>

So I tried: 

AT%XMODEMTRACE=1,2

That didn't change anything. 

The manual:

# %XMODEMTRACE=<oper>[,<set_id>[,<bitmap_id>,<bitmap>]]
# <oper>
#    0 – Deactivate traces.
#    1 – Activate predefined trace set.
#    2 – Activate trace bitmap. To be used only on request by Nordic customer support.
#    3 – Read trace bitmap. To be used only on request by Nordic customer support.
# <set_id>
#    1 – Coredump only.
#    2 – Long-Term Evolution (LTE), Internet Protocol (IP), GNSS, and coredump.
#    3 – Reserved for future use.
#    4 – IP only.
#    5 – LTE and IP.

So I tried several others, thinking the bit-map was messed up.
Googling for exotic and novel <operations>, and <bitmaps>, I also tried: 

AT%XMODEMTRACE=1,20
AT%XMODEMTRACE=1,21

They also didn't enable NAS. (I.e. They did seemingly nothing.)

So then I also checked the yet undocumented <bitmaps>:


AT%XMODEMTRACE=3,2,0    # %XMODEMTRACE: "00000000000000000000F0403F0004"
AT%XMODEMTRACE=3,2,1    # %XMODEMTRACE:  "00"
AT%XMODEMTRACE=3,2,2    # %XMODEMTRACE: "9DFFFF00"
AT%XMODEMTRACE=3,2,3    # %XMODEMTRACE: "FDB7F4967E9177B7CFFD4947E77BFEC930BB09DCABD1777F77EFDE75F7DF5BF7BBB71B"
AT%XMODEMTRACE=3,2,4    # %XMODEMTRACE: "0F"


What all those <sets> are representing?

What part is enabling more trace detail for the LTE/NAS/RRC/L1 ?

PS. I was also checking your DevAcademy, and nothing there is mentioning this.

Parents
  • Hello,

    can you provide some information about what version of Cellular Monitor and SDK version?

  • Hi Hakan!

    It's kind of weird that my questions are met with a counter question... 

    I'm using the latest tools provided!
    - "Cellular Monitor" v.2.6.0
    - IDK, where to find the SDK version?

    However, the FW that's on the device was compiled and loaded 2+ years ago, on a different machine, so I don't recall what was the SDK then. But, as I said, it was working fine just like before until ~3 weeks ago until I updated all tools. I didn't realize immediately that it might have to do with the updated tool. I suppose maybe they are sending some different initialization commands or strings to the modem?

    It would be more helpful if you could explain how the bitmap works and why the NAS is not mentioned and part of the LTE tarce?

    I have 50k sized binary traces, but when looking at the supposed pcapng equivalent with wireshark there are only 2 lines from AT and RRC commands! 

  • EAB said:

    It's kind of weird that my questions are met with a counter question... 

    I'm using the latest tools provided!
    - "Cellular Monitor" v.2.6.0
    - IDK, where to find the SDK version?

    Whether you find this "weird" is not really my problem :). I need to know what versions are failing so I can reproduce. I will try to reproduce this with Cellular Monitor v2.6.0 and see if I get the same result.


  • I had this at the time.
    I tried to upgrade, but got another error...

    # nrfutil sdk-manager install v3.2.1
    
    Using the global server for downloads. Use '--region cn' for the server in Mainland China.
    [00:05:55] ###### 100% [Download toolchain v3.2.1] Toolchain downloaded
    [00:00:46] ###### 100% [Unpack toolchain v3.2.1] Toolchain unpacked to C:\ncs\tmp\.tmpvJXibY
    [00:00:00] ###### 100% [Install toolchain v3.2.1] Toolchain installed at C:\ncs\toolchains\66cdf9b75e
    [00:16:22] ###### 100% [Download SDK v3.2.1] Download SDK v3.2.1
    [00:00:03] ###### 100% [Calculating SDK checksum] Verified download
    [00:00:50] ###### 100% [Unpack SDK v3.2.1] Unpacked SDK tarball
    Warning: Unable to create symlinks during unpacking. Consider enabling 'Developer Mode' in your system settings to allow symlink creation.
    
    A list of the affected paths has been written to: C:\tmp\nrfutil-sdk-manager-symlinks-k3TZvV.txt


    With messages like that, it's very hard to make anything working. 
    What symlinks are needed?

Reply


  • I had this at the time.
    I tried to upgrade, but got another error...

    # nrfutil sdk-manager install v3.2.1
    
    Using the global server for downloads. Use '--region cn' for the server in Mainland China.
    [00:05:55] ###### 100% [Download toolchain v3.2.1] Toolchain downloaded
    [00:00:46] ###### 100% [Unpack toolchain v3.2.1] Toolchain unpacked to C:\ncs\tmp\.tmpvJXibY
    [00:00:00] ###### 100% [Install toolchain v3.2.1] Toolchain installed at C:\ncs\toolchains\66cdf9b75e
    [00:16:22] ###### 100% [Download SDK v3.2.1] Download SDK v3.2.1
    [00:00:03] ###### 100% [Calculating SDK checksum] Verified download
    [00:00:50] ###### 100% [Unpack SDK v3.2.1] Unpacked SDK tarball
    Warning: Unable to create symlinks during unpacking. Consider enabling 'Developer Mode' in your system settings to allow symlink creation.
    
    A list of the affected paths has been written to: C:\tmp\nrfutil-sdk-manager-symlinks-k3TZvV.txt


    With messages like that, it's very hard to make anything working. 
    What symlinks are needed?

Children
  • EAB said:
    I tried to upgrade, but got another error...

    It's not an error, it's a warning. And I believe you should not worry too much about it, it is intended behavior;

    https://docs.nordicsemi.com/bundle/nrfutil/page/nrfutil-sdk-manager/CHANGELOG.html#d72e394 

  • So the intended behavior is that I am not able to run 'west' on my system? ;)

    It would really be much more helpful if you'd instead address the actual questions.

    I just tried to run app on 2 other devices (one of the same, and another on 9160-DK), they both shows NAS messages. So can you please come up with some more proactive answers or at least let me know what other info you need from me in order to help fix/resolve the issues?

    What are the symlinks needed to be able to run west (for example)? 

    Running west from its location results in this: 


    $ .\west.exe
    Traceback (most recent call last):
      File "<frozen runpy>", line 198, in _run_module_as_main
      File "<frozen runpy>", line 88, in _run_code
      File "C:\ncs\toolchains\0b393f9e1b\opt\bin\Scripts\west.exe\__main__.py", line 4, in <module>
    ModuleNotFoundError: No module named 'west'


  • EAB said:
    So the intended behavior is that I am not able to run 'west' on my system?

    No, the error is exactly what I said in my previous reply. The warning you are seeing is not an error, it is intended behavior; https://docs.nordicsemi.com/bundle/nrfutil/page/nrfutil-sdk-manager/CHANGELOG.html#d72e394 .

    If you have issues upgrading NCS or west related issues, please create a separate ticket. I will focus on your original question which was related to modem trace.

    For the record, I tested this using cellular monitor v2.6.0, and SDK v3.2.0. Modem tracing enabled using snippets. As far as I know, no need to run the AT%XMODEMTRACE=1,2 command at all, but you can probably do that too. Here is what I got;

    So everything is working as intended on my end.

    You may not like being asked questions here, but I will need to ask you to provide more information. Because I am not able to replicate your issue. Please describe in detail your setup including SDK version and mfw version, how you enabled modem tracing etc. 

Related