Very strange, I have lots of nRF52x experience, but this one has me stumped.
Successfully updated our custom board/application from nRF5_SDK_15.0.0 to latest as indicated below:
Setups:
SDK: nRF5_SDK_16.0.0_98a08e2
SoftDevice:
FreeRTOS (from SDK)
Segger Embedded Studio (same issue on 4.12 / 4.18 / 4.50)
Windows 10
Custom board
Preprocessor definitions:
BOARD_CUSTOM
NRF52
NRF52832_XXAA
NRF52_PAN_74
S132
SOFTDEVICE_PRESENT
NRF_SD_BLE_API_VERSION=7
CONFIG_NFCT_PINS_AS_GPIOS
FLOAT_ABI_HARD
INITIALIZE_USER_SECTIONS
NO_VTOR_CONFIG
ARM_MATH_CM4
FREERTOS
After migrating to SKD16, everything works very nicely. It is a reasonably complex application.
We use default flash_placement.xml from SDK16 example applications.
Application passes all of our testing. In Debug mode, NRF_LOG via RTT is active. This all operates fine.
Verified we have excess RAM available to the application. RAM_START=0x20002a98.
ret_code_t ret_code = sd_ble_enable(p_app_ram_start); returns a start value of 0x20002220 ... so we are good here.
To help me isolate the problem, I have erased my nRF52832 IC, and no longer are using our Bootloader.
Only the Softdevice and Application are being loaded via SES.
The last to do item was to re-enable our JLINK debug monitor. This is the ONLY change we are making to the application
We use the recommended method, as outlined in https://github.com/NordicPlayground/j-link-monitoring-mode-debugging. We use the 3 files as is unmodified.
We use the SDK16.0.0 branch, and our JLINK options are set to:
SetMonModeDebug = 1
SetMonModeVTableAddr = 0x26000
We execute NVIC_SetPriority(DebugMonitor_IRQn, _PRIO_SD_LOW); in our Logger task.
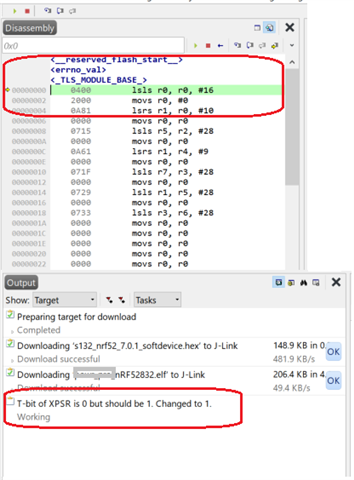
When we do this, our application does not startup up at all, and the SES Debugger shows us at address 0x00000000 ... see attached picture below [Crash.png]
Note also the messaging indicating: T-bit of XPSR is 0 but should be 1. Changed to 1.
To further isolate the problem, I commented out NVIC_SetPriority(DebugMonitor_IRQn, _PRIO_SD_LOW); ... but no change...
Very weird ... [DebugMon_Handler] is being compiled in, but not being executed.
... and all of this causes the SES to fail in loading the application. I am a bit stymied.
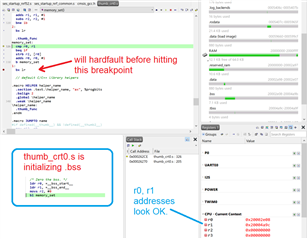
I tried setting early breakpoints in thumb_crt0.s ... but it would not hit any of the early breakpoints.
As a very last investigative step, I took the SDK 16.0.0 example application, and modified it to support JLINK_MONITOR ...
... after some tweaking ... works like a charm :}
Free beer to whoever can solve my problem :}