This post is older than 2 years and might not be relevant anymore
More Info: Consider searching for newer posts

No sleep during nrf_drv_twi_rx with LIS3DH

I have been converting my TWI calls to be asynchronous by specifying a twi_handler, but my NRF52840 does not sleep during the TWI calls.

I use SDK15.3 and s140 softdevice. (I plan to upgrade to SDK17 soon)

When reading the 32 latest XYZ values (192 bytes) from my accelerometer (LIS3DH) I see overall power usage of ~6.6mA for 7.3ms on my PPK2 power profiler. 
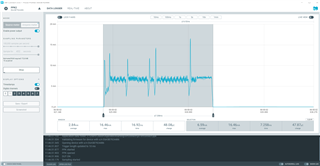
When I profile the LIS3DH power usage in isolation I see that it is using ~1mA for ~5ms.
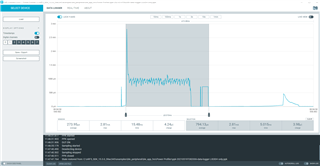
I have tested with my custom board and also with a breadboarded NRF52840 Dongle + Sparkfun LIS3DH. I see almost exactly the same on my custom board as on the breadboard with a NRF52840 dongle + Sparkfun LIS3DH

I do not understand why the NRF52840 is not sleeping.

I see ~11uA power usage before and after the TWI calls.

To talk to the LIS3DH I wrote a state machine which runs every ~1100ms, started by a timer. I make the following TWI calls in the state machine.

  if (twi_LIS3DH_step == 100)
  {
    uint8_t reg = LIS3DH_FIFO_SRC_REG;
    nrf_drv_twi_tx(&m_twi, LIS3DH_ADDRESS , &reg, 1, false);                     // ask for fifo_src
  }                                                                             
  else if (twi_LIS3DH_step == 101)                                              
  {
    nrf_drv_twi_rx(&m_twi, LIS3DH_ADDRESS , &fifo_src, 1);                      // read fifo_src to get num_samples to read
  }                                                                             
  else if (twi_LIS3DH_step == 102)                                              
  {
    num_samples = fifo_src & 0b00011111;                                        
    uint8_t reg = LIS3DH_OUT_X_L | 0x80;                                        
    nrf_drv_twi_tx(&m_twi, LIS3DH_ADDRESS , &reg, 1, true);                     // ask for samples
  }                                                                             
  else if (twi_LIS3DH_step == 103)                                              
  {                         
    nrf_drv_twi_rx(&m_twi, LIS3DH_ADDRESS , byte_array, 6*num_samples);         // read samples (6*num_samples)
  }
  else if (twi_LIS3DH_step == 104)
  {
    //Here I normally call a function to process the samples we received but it is commented out at the moment

    twi_LIS3DH_step = 0;
  }

  twi_LIS3DH_step++;
  twi_LIS3DH_can_step = false;    //wait until twi_handler sets this to true before doing next step

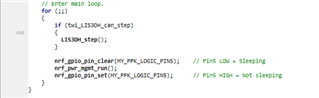
 My main loop steps the state machine.

    // Enter main loop.
    for (;;)
    {
//       send_data_to_peers();
        if (twi_LIS3DH_can_step)
        {
          LIS3DH_step();
        }
        if (twi_TMP112_can_step)
        {
          TMP112_step();
        }
        idle_state_handle();
    }

idle_state_handle looks like this.  I have disabled logging with NRF_LOG_ENABLED = 0. I do not printf anything 

static void idle_state_handle(void)
{ 
  while (NRF_LOG_PROCESS());

  nrf_pwr_mgmt_run();
}

The twi_handler allows the next step to proceed by setting twi_LIS3DH_can_step = true

void twi_handler(nrf_drv_twi_evt_t const * p_event, void * p_context)
{
  static uint8_t slave_address;
  slave_address = p_event->xfer_desc.address;

  if (slave_address == LIS3DH_ADDRESS)
  {
    if (twi_LIS3DH_step >= 100)
    {
      twi_LIS3DH_can_step = true;
    }
  }
  else if (slave_address == TMP112_ADDRESS)
  {
    if (twi_TMP112_step >= 100)
    {
      twi_TMP112_can_step = true;
    }
  }
}

I have tried setting the TWI .frequency to 400khz, 250K and 100K which just makes the transmission proportionally more time-consuming.

When I reduce the number of bytes requested from 192 to 100, 10 etc I see an approximately proportionally shorter transmission time. 

I have tried changing the TWI .interrupt_priority to APP_IRQ_PRIORITY_LOW, APP_IRQ_PRIORITY_MID and APP_IRQ_PRIORITY_HIGH.

What else could be causing this?

Any help is greatly appreciated. I have spent several days on this and I'm running out of ideas.

Kind regards,

-Jason

Parents
  • Hi,


    in your twi_handler, you should check the evt type to see if there's an error that has occurred.

    You should also check the return code from the nrf_drv_twi_* calls.


    Since you mention timers, and twi callbacks, you should look into declaring any variables incremented/set in those to volatile.


    Kind regards,

    Håkon

  • Thanks, they're all marked as volatile and I don't get any error codes from the nrf_drv_twi_* calls.

    Is there any way to know why it doesn't enter sleep mode?

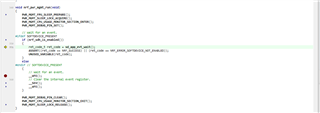
    My main loop calls nrf_pwr_mgmt_run() immediately after the  nrf_drv_twi_* calls.

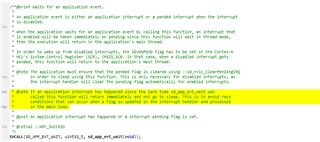
    When I look at sd_app_evt_wait I see this comment about interrupts. The 2nd note sounds relevant.

    Obviously I cannot step into sd_app_evt_wait.

    Could the calls to  nrf_drv_twi_* have immediately caused an interrupt?

    It's really only the call to get eh 192 bytes of accelerometer data that I really care about and it appears to take >5ms to complete. 

  • I think I have a race condition because some nrf_drv_twi_ calls respond so quickly. I am working to debug it at the moment.

  • There was no race condition.

    I've made some significant progress that maybe you can help me with.

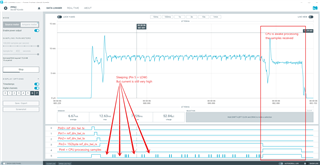
    I changed the code to perform the first 3 (of 4) twi calls synchronously, and the 4th call is the time-consuming one which I run asynchronously. I also hooked up the PPK2 logic analyser to show where the time was spent. See screenshot below

    Pins 0,1,2, show time spent in twi_tx, twi_rx, twi_tx.

    Pin 3 show time spent receiving 192 bytes in twi_rx 

    Pin 4 shows the time spent processing the samples (moving averages etc)

    Pin 5 shows time spent inside nrf_pwr_mgmt_run. This is the most interesting because it shows that lots of time is spent inside nrf_pwr_mgmt_run() but the current is still high.

    I expected the current to drop to a few uA's while the NRF52840 is inside nrf_pwr_mgmt_run() 

    I am confused by this result because it seems to show that the code is inside nrf_pwr_mgmt_run but the current is still very high. 

  • Hi,


    The CPU seems to be in sleep mode for most of the time.

    Any current going through the pull-resistors should not be much higher than ~1 mA, and the sleep current with an active TWIM (w/DMA) should be around 1.5 mA.

    The 192 bytes should be read in one transaction, but you have several wake-ups within this TWIM reception. Is there anything else running in your system while this process is on-going?


    Kind regards,

    Håkon

Reply
  • Hi,


    The CPU seems to be in sleep mode for most of the time.

    Any current going through the pull-resistors should not be much higher than ~1 mA, and the sleep current with an active TWIM (w/DMA) should be around 1.5 mA.

    The 192 bytes should be read in one transaction, but you have several wake-ups within this TWIM reception. Is there anything else running in your system while this process is on-going?


    Kind regards,

    Håkon

Children
Related