This post is older than 2 years and might not be relevant anymore
More Info: Consider searching for newer posts

nRF sniffer for nRF52840: Can not set filter

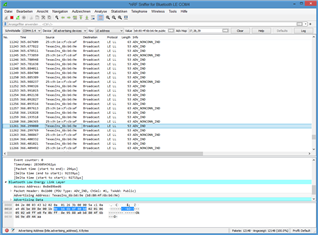
2. In the nRF sniffer software, the device I'm interested in does not show up in the "Source" column with its addess, b8:80:4f:6b:b6:9e, but as "TexasIns_6b:b6:9e". It seems this prevents me from filtering. If a filter is added for the device's address (eth.src == b8:80:4f:6b:b6:9e), all events disappear and no new events appear. I'm not allowed to enter "eth.src == TexasIns_6b:b6:90" as filter: "not a valid ethernet address". Is there a work-around?!

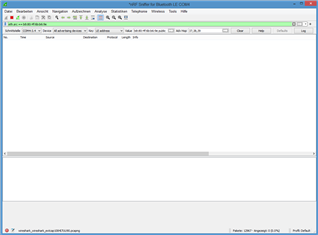
2. Another problem is that the drop-down devices list (inital content: "All advertising devices") is not populated. "All advertising devices" remains the only entry. It was populated when I used the program for the first time but not now (and it was only partially populated; my device was not in it). Windows 8.1

/resized-image/__size/320x236/__key/communityserver-discussions-components-files/4/Screenshot-1.PNG

/resized-image/__size/320x236/__key/communityserver-discussions-components-files/4/Screenshot-2.PNG

Parents Reply Children
  • 1. It does not look like a driver problem (after manually installing one). BLE packets are sniffed and show up in Wireshark, including advertisements. The packets required to build a device list apparently arrive, they just don't get translated into a device list. This seems to be an issue on a higher level (python code of capture filter?). I've tried different versions of Wireshark (back to 2019) and Python (python-3.7.9-amd64, python-3.9.7-amd64) to exclude incompatibility with the latest versions.

    2. The Python code of the Nordic sniffer capture filter contains logging statements, such as this one in nrf_sniffer_ble.py:

    log = "Scanning all advertising devices"
    logging.info(log)

    Do you know how/where these log messages can be viewed? I don't think it's the log displayed by the "Log" button in the user interface of Wireshark because above message is not in there:

    INFO: Log started at Fri Sep 24 14:28:02 2021
    INFO: Extcap version 3.4
    INFO: Opening serial port COM4
    INFO: closing UART
    INFO: Opening serial port COM4
    INFO: args: ()
    INFO: kwargs: {'callbacks': [('*', <bound method Notifier.passOnNotification of <Sniffer(Thread-3, initial)>>)]}
    INFO: board ID: 4
    INFO: Sniffer created
    INFO: Software version: 4.0.0
    INFO: sniffer started
    INFO: Firmware version 4.0.0
    INFO: starting scan
    INFO: Firmware timestamp 742688758 reference: Sep 24 2021 14:28:02.835117 Mitteleuropäische Sommerzeit

  • Hi,

    dtmr said:
    I've tried different versions of Wireshark (back to 2019) and Python (python-3.7.9-amd64, python-3.9.7-amd64) to exclude incompatibility with the latest versions.

    Can it work now? If it still not, you might contact https://www.wireshark.org/. for the GUI issue. 

    dtmr said:
    Do you know how/where these log messages can be viewed?

    On windows:

    %appdata%/Nordic Semiconductor/Sniffer/logs

    -Amanda

  • > Can it work now? If it still not, you might contact https://www.wireshark.org/. for the GUI issue.

    After some Wireshark starts, the device drop-down list works. Most often it remains empty. This appears to be random. I don't see a difference between a good start and a bad start in the log. The device drop-down list was filled often enough to get my work done, so I'm not going to investigate further. Thanks for your help so far.

Related