SOFTDEVICE: ASSERTION FAILED PC=0x00000A60

Hi,

Application details:

I have a datalogger application that samples data every second. It uses the following modules:

TWIM0 -> To communicate with external RTC clock via I2C.

TWIM1 -> To send data to external display via I2C.

SPIM2 -> To get data from an external ADC with sensor.

QSPI -> To save data to an external memory.

I use BLE central to scan and connect to another custom peripheral device using long range PHY. I send all the data every 10 mins to this device which works as a router.

Everything works correctly most of the time. The application continues to sample when the data is being sent simultaneously.

Issue:

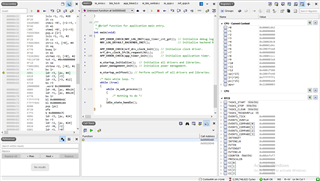
I get a SOFTDEVICE: ASSERTION FAILED that happens inconsistently about 5 to 10 times a day when the BLE central is sending the data. You can see the call stack and PC in the attached picture.

I am using nRF SDK v16.0.0 with s140_nrf52_7.0.1_softdevice. Could you please help me with this issue?

Parents
  • Hi,

    You write th t you get a SOFTDEVICE: ASSERTION FAILED but I do not see the relevant address for that. Can you double check to verify that you actually see a SoftDevice assert and get the PC from then? (There is no SoftDevice assert for S140 7.0.1 at 0x00000A60).

  • Hi Einar,

    Thanks for getting back to me. I usually see SOFTDEVICE: ASSERTION FAILED after I click on continue running the code. Although, this time I got this error as shown in the attached picture.

    I will try and recreate this issue today and get back to you with a screenshot of the SOFTDEVICE: ASSERTION FAILED.

    Any idea as to why the softdevice paused the code based on the previous screenshot? I'm guessing the issue was caused at 0x00020D48.

  • Hi,

    Thanks, this is wat I was looking for. 0x020d46 is the location of an assert in S140 7.0.1.

    Can you say more about when you get this assert? And your interrupt configuration? (Which interrupt priorities do you have for other interrupts in the system?).

    Also, note that if you debug wile in a connection you cannot break or step or similar, or the SoftDevice will assert - so please double check that that was not what happened here.

  • Hi Einar,

    I have 2 central devices (datalogger) connected to 1 peripheral device (router). I use coded PHY for the communication. I usually do not get any error when the router is close (<5m approx.) to the dataloggers. When the router is placed further away (>10m approx.), I get this issue intermittently at the datalogger. Both dataloggers are sending data to the router, connected at 7.5mS connection interval.

    For both applications all my interrupts are set to APP_IRQ_PRIORITY_LOW, except for the cellular modem communicating via UART is set to APP_IRQ_PRIORITY_MID at the router. Could this be the cause of the issue? I tried setting it to APP_IRQ_PRIORITY_LOW, but I get a lot of errors while communicating with the modem when I do this. I am using app_uart_fifo library for communicating with the modem. I think the higher priority IRQ BLE library causes some of the bytes to be missed while the UART is communicating when set to APP_IRQ_PRIORITY_LOW. How could I solve this issue?

    Thanks.

  • Also, yes I did not break or step while in debug. The debugger paused on its own, I have no break points set in code.

    I also tried using APP_IRQ_PRIORITY_LOW_MID for UART0. This gave me the same error as APP_IRQ_PRIORITY_MID at 0x00020D48.

  • Hi,

    CodeVader said:
    I also tried using APP_IRQ_PRIORITY_LOW_MID for UART0. This gave me the same error as APP_IRQ_PRIORITY_MID

    That is good to know, as _PRIO_APP_LOW_MID is lower priority than _PRIO_SD_LOW. If you don't have any other higher application interrupts, we can ignore those going forward.

    In a nutshell you get this assert on the central device (datalogger), which has a single link in the central role, right? Is that the only role this device has or does it also maintain other connections, scan and/or advertise while in the connection?

    You write that you see this more with increased distance to the peer (router). Have you confirmed that this is consistent?  What happens on your central device if the throughput is lower than you normally would need (for instance caused by packet drops)?

    I discussed this with the SoftDevice team and they have some questions:

    • Which LFCLK source are you using? LFXO or LFRC? What is your clock configuration (NRF_SDH_CLOCK_LF_* defines in sdk_config.h)?
    • Do you buy any chance use high duty cycle directed advertising? (I see no indication of that in what you have written, but we fixed a bug related to that in SoftDevice 7.1 which has some similarities).
  • Hi Einar,

    Yes, the datalogger has a single link in the central role. It also acts as a peripheral device using 1MBPS PHY, advertising at 1 second. The peripheral and central role can be simultaneous. When the error occurred the peripheral was in advertising state. I have also seen the error occur with the advertising disabled.

    Yes, I have confirmed the error occurs with distance (more than 3 tests).

    I have done a distance test with 3 dataloggers and 1 router. During this test I tried increased distances of up to 100 meters. There were a quite a few packet drops (I saw the failure to communicate via BLE at the router end). Only one of the dataloggers had a reset.

    As far as the LFCLK goes, I use the LFXO.

    // Low frequency clock source to be used by the SoftDevice
    #define NRF_CLOCK_LFCLKSRC                                 \
        {                                                      \
            .source = NRF_CLOCK_LF_SRC_XTAL,                   \
            .rc_ctiv = 0,                                      \
            .rc_temp_ctiv = 0,                                 \
            .xtal_accuracy = NRF_CLOCK_LF_XTAL_ACCURACY_20_PPM \
        }
    No, I do not use high duty cycle directed advertising.
    On a side note, I do have a few app_timers running. I used to get NRF_ERROR_NO_MEM error from timer_req_schedule() in app_timer2.c. This error use to happen in similar intermittency as the softdevice assert. I was getting this error before the softdevice error showed up. I enabled APP_TIMER_WITH_PROFILER in the sdk_config.h and I stopped getting this error. I am not sure but does this have something to do with this issue. I also increased the APP_TIMER_CONFIG_OP_QUEUE_SIZE to 50. I donot get the NRF_ERROR_NO_MEM issue anymore.
    I have attached the sdk_config.h file.
Reply
  • Hi Einar,

    Yes, the datalogger has a single link in the central role. It also acts as a peripheral device using 1MBPS PHY, advertising at 1 second. The peripheral and central role can be simultaneous. When the error occurred the peripheral was in advertising state. I have also seen the error occur with the advertising disabled.

    Yes, I have confirmed the error occurs with distance (more than 3 tests).

    I have done a distance test with 3 dataloggers and 1 router. During this test I tried increased distances of up to 100 meters. There were a quite a few packet drops (I saw the failure to communicate via BLE at the router end). Only one of the dataloggers had a reset.

    As far as the LFCLK goes, I use the LFXO.

    // Low frequency clock source to be used by the SoftDevice
    #define NRF_CLOCK_LFCLKSRC                                 \
        {                                                      \
            .source = NRF_CLOCK_LF_SRC_XTAL,                   \
            .rc_ctiv = 0,                                      \
            .rc_temp_ctiv = 0,                                 \
            .xtal_accuracy = NRF_CLOCK_LF_XTAL_ACCURACY_20_PPM \
        }
    No, I do not use high duty cycle directed advertising.
    On a side note, I do have a few app_timers running. I used to get NRF_ERROR_NO_MEM error from timer_req_schedule() in app_timer2.c. This error use to happen in similar intermittency as the softdevice assert. I was getting this error before the softdevice error showed up. I enabled APP_TIMER_WITH_PROFILER in the sdk_config.h and I stopped getting this error. I am not sure but does this have something to do with this issue. I also increased the APP_TIMER_CONFIG_OP_QUEUE_SIZE to 50. I donot get the NRF_ERROR_NO_MEM issue anymore.
    I have attached the sdk_config.h file.
Children
  • Hi,

    Thanks for the information. I have discussed this with the SoftDevice team and they have some more questions in order to hopefully better understand the situation:

    1. Does the link use S2 or S8 encoding?
    2. Are there any data length updates?
    3. Are only the datalogger an nRF, or are both device types nRF devices, and both nRF52840 with SDK 16 and S140 7.0.1?
    4. Can you make a sniffer trace of the connection, preferably including what happens up to you get the assert? In that case it would be good to have the sniffer close to the asserting device (datalogger) to get the timings to match as good as possible with what is seen by the asserting device.
    CodeVader said:
    I used to get NRF_ERROR_NO_MEM error from timer_req_schedule() in app_timer2.c. This error use to happen in similar intermittency as the softdevice assert.

    This should be independent of the SoftDevice, so I do not immediately see a connection. But we will keep it in mind.

  • Hi Einar,

    1. I am not sure what encoding it uses, where can I find this information?

    2. Please see the log below for successful connection:

    [00:00:52.665,649] <info> app: m_ble_central_connect
    [00:00:52.666,564] <info> app: Display-> BLE: 6. CONNECT!
    [00:00:52.674,621] <info> app: scan_start() -> 1
    [00:00:53.330,627] <info> app: scan_evt_handler() -> Connected RSSI = -45
    [00:00:53.330,688] <info> app: on_ble_central_evt() -> Connected, handle: 0.
    [00:00:53.395,019] <info> app: PM_EVT_CONN_SEC_PARAMS_REQ
    [00:00:53.395,141] <info> app: PM_EVT_CONN_SEC_START
    [00:00:53.395,202] <info> app: PM_EVT_SLAVE_SECURITY_REQ
    [00:00:53.484,802] <info> app: gatt_evt_handler() -> GATT ATT MTU on connection 0x0 changed to 247.
    [00:00:53.484,924] <info> app: on_ble_central_evt() -> Current MTU: 247

    [00:00:53.516,418] <info> app: PM_EVT_CONN_SEC_PARAMS_REQ
    [00:00:54.034,729] <info> peer_manager_handler: Connection secured: role: Central, conn_handle: 0, procedure: Bonding
    [00:00:54.034,973] <info> app: PM_EVT_CONN_SEC_SUCCEEDED
    [00:00:54.035,034] <info> app: on_ble_central_evt() -> BLE_GAP_EVT_AUTH_STATUS: status=0x0 bond=0x1 lv4: 0 kdist_own:0x3 kdist_peer:0x3
    [00:00:54.039,611] <info> peer_manager_handler: Peer data updated in flash: peer_id: 0, data_id: Bonding data, action: Update
    [00:00:54.039,672] <info> app: PM_EVT_PEER_DATA_UPDATE_SUCCEEDED
    [00:00:54.041,564] <info> peer_manager_handler: Peer data updated in flash: peer_id: 0, data_id: Peer rank, action: Update
    [00:00:54.041,564] <info> app: PM_EVT_PEER_DATA_UPDATE_SUCCEEDED
    [00:00:54.043,518] <info> peer_manager_handler: Peer data updated in flash: peer_id: 0, data_id: Local database, action: Update
    [00:00:54.043,579] <info> app: PM_EVT_PEER_DATA_UPDATE_SUCCEEDED
    [00:00:54.054,870] <info> app: ble_trs_c_evt_handler() -> Discovery complete.
    [00:00:54.054,870] <info> app: PM_EVT_CONN_SEC_PARAMS_REQ
    [00:00:54.054,992] <info> app: PM_EVT_CONN_SEC_START
    [00:00:54.055,114] <info> app: ble_trs_c_evt_handler() -> Connected TRS Service.
    [00:00:54.056,457] <info> app: scan_start() -> 0
    [00:00:54.474,304] <info> peer_manager_handler: Connection secured: role: Central, conn_handle: 0, procedure: Encryption
    [00:00:54.474,304] <info> peer_manager_handler: Peer data updated in flash: peer_id: 0, data_id: Peer rank, action: Update, no change
    [00:00:54.474,365] <info> app: PM_EVT_PEER_DATA_UPDATE_SUCCEEDED
    [00:00:54.474,365] <info> app: PM_EVT_CONN_SEC_SUCCEEDED
    [00:00:58.553,955] <info> app: on_ble_central_evt() -> Parameters update success.
    [00:01:04.067,260] <info> app: on_ble_central_evt() -> BLE_GATTC_EVT_WRITE_CMD_TX_COMPLETE
    [00:01:04.120,300] <info> app: on_ble_central_evt() -> BLE_GATTC_EVT_WRITE_CMD_TX_COMPLETE
    [00:01:04.136,779] <info> app: m_peripherals_capacitor_sample
    [00:01:04.140,258] <info> app: m_ble_central_txrx
    [00:01:04.141,174] <info> app: Display-> BLE: 7. TXRX!
    [00:01:04.157,226] <info> app: on_ble_central_evt() -> BLE_GATTC_EVT_WRITE_CMD_TX_COMPLETE
    [00:01:04.180,053] <info> app: on_ble_central_evt() -> BLE_GATTC_EVT_WRITE_CMD_TX_COMPLETE
    [00:01:04.240,905] <info> app: on_ble_central_evt() -> BLE_GATTC_EVT_WRITE_CMD_TX_COMPLETE
    [00:01:07.653,930] <info> app: m_peripherals_capacitor_sample
    [00:01:07.657,409] <info> app: m_ble_central_disconnect
    [00:01:07.658,325] <info> app: Display-> BLE: 8. DISCON!
    [00:01:07.696,960] <info> app: ble_trs_c_evt_handler() -> Disconnected.
    [00:01:07.696,960] <info> app: on_ble_central_evt() -> Disconnected, handle: 0, reason: 0x16

    3. Both datalogger and router are nRF52840 with SDK 16 and S140 7.0.1.

    4. I'm not sure if I can get a sniffer trace for coded PHY using the nrf52840dk_dongle. Is there a way I can do this?

  • Ignore point 4. I have figured out how to trace coded PHY. I will send you the trace soon. Thanks.

  • Hi,

    Thanks for the info, and good to hear you found out how to make the sniffer trace. We look forward to getting that.

    CodeVader said:
    1. I am not sure what encoding it uses, where can I find this information?

    As I see from 3 that you are using the SoftDevice in both ends, so then you are using S=8 (it does not have APIs for sending S=2, but it can receive S=2 packets sent by a peer that use it).

    CodeVader said:
    2. Please see the log below for successful connection:

    Thanks. I do not see a log indicating data length update (DLE), but as I don't know your code I cannot see if you do any logging when that (potentially) happens (on the BLE_GAP_EVT_DATA_LENGTH_UPDATE event)? We will also see this from the sniffer trace when we get it, though.

  • Hi Einar,

    I think I was able to solve this issue. I was using connection interval 7.5mS (min and max) for the peripheral device. This was probably causing the central devices to assert when the distance was increased. I changed the connection interval to 50mS (min and max) for the peripheral, and I do not get this issue anymore.

    I didn't have much luck with the sniffer as it kept losing the connection packets, although the dataloggers and router were still connected. Hence, I was unable to get a sniffer trace for when the issue happens. Please see the attached sniffer trace that I was able to get with the 50mS connection interval.

    I am planning to connect at least 5 dataloggers to the router. Please let me know what would be the best connection interval to use for this, or how I could calculate it for coded PHY.

    Thanks for all your help.Sniffer_output.pcapng

Related