Thingy:91 and current consumption

Hi!

I have a Thingy:91 v1.6.0 and doing some current measurement on the device.
I've disconnected the LiPo cell, and feed the Thingy from an Otii connected to the P3 (Li-po) connector using 4.0v.
The Thingy is then connected via JTAG cable to a nRF9160DK (for FW upload).

The unit is successfully registered in the nRF Cloud, and sends and works as expected.

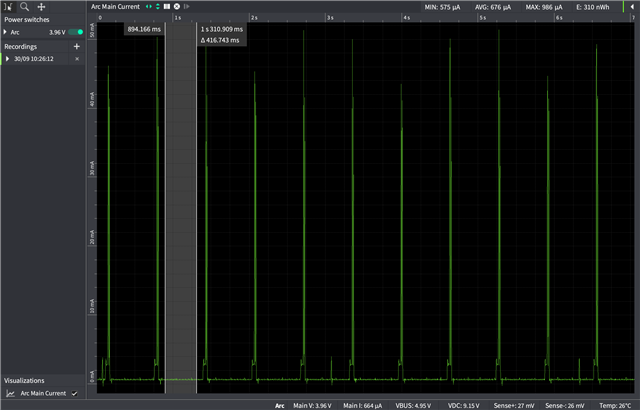
When measuring the Thingy current consumption I see regular current spikes (all the time) reaching ~40mA coming every ~630ms, this on top of an idle current of ~650uA, this is with your FW example from the asset_tracker_v2 fetched from your download site (nrf9160dk_fw_2022-06-02_880c82db.zip).
All current measurements are done with the JTAG cable disconnected.
Is this to be expected?

After reading other similar cases here I've tried out a few tings:
I have tested a FW version with "switching off" the nRF9160 by putting in a main program like this:


void main(void){
    NRF_REGULATORS->SYSTEMOFF = 1;
    for(;;){}
}

and then I see an idle current of 15-20uA, so the I assume both HW and other sensors on the Thingy should be fine.

I also have built a FW based on the asset_tracker_v2 (with SDK2.0.0), and with the overlay-low-power.conf when building.
Then I measure some 275uA idle current, but still the 40mA spikes every 630mS continues (see attached Otii picture).

Do you know what is causing these current spikes?

In addition to the overlay-low-power.conf I've put  an additional config, the purpose is to disable GPS and enable PSM:

# Turn off all GPS stuff
CONFIG_NRF_CLOUD_PGPS=n
CONFIG_NRF_CLOUD_AGPS=n
CONFIG_LTE_NETWORK_MODE_LTE_M_GPS=n
CONFIG_DATA_SAMPLE_GNSS_DEFAULT=n
CONFIG_APP_REQUEST_GNSS_ON_INITIAL_SAMPLING=n
CONFIG_GNSS_MODULE=n

# Set active
CONFIG_DATA_DEVICE_MODE=y

# Set sample rate
CONFIG_DATA_ACTIVE_TIMEOUT_SECONDS=600
CONFIG_DATA_MOVEMENT_RESOLUTION_SECONDS=60
CONFIG_DATA_MOVEMENT_TIMEOUT_SECONDS=1200
CONFIG_DATA_ACCELEROMETER_THRESHOLD=10

# Power saving timers
CONFIG_LTE_PSM_REQ_RPTAU="00000110"
CONFIG_LTE_PSM_REQ_RAT="00000000"

The PSM timer values are fetched from your Online Power Profiler.

Any directions of advice in order to reduce power consumption would be appreciated!

Thanks!
-Alf

Parents
  • Hi, the 600 uA base current is probably because of the logging module which uses UART. Please have a look at my answer in this thread, which explains how to turn off the UART in the LwM2M sample. It should be similar in the asset tracker sample.

    The ~630 ms (which I believe should be 640 ms) spikes could be DRX paging. I'm thinking that the modem does not enter PSM mode, and continues in RRC idle mode, aka. eDRX, iDRX, etc. In the online power profiler you can simulate this by turning off PSM, and set the iDRX interval to 0.64. Of course this assumes that you are getting these spikes after a successful connection to the network. Is that correct?

    Please have a look at this guide for more information regarding how to check if the network supports PSM or not:  Getting started with current measurements on the nRF9160

    The guide suggests using either the UDP example, or AT commands directly to check the network status.

    A quick note about the UDP sample; it has UART logging disabled by default in order to demonstrate a power optimized application, and to fit the numbers in the online power profiler. In order to see the network connection status log output, you need to turn on the serial module by changing CONFIG_SERIAL to =y in the prj.conf file. Now you will also see that the current consumption increases by around 600 uA, which matches your initial measurements of the asset tracker application.

    Best regards,
    Stian

  • Hi Stian, and thanks for good and informative hints!

    I've done some "research" against our sim provider, and we are now successfully running PSM (against Telenor).
    The 640ms spikes we saw earlier was due to eDRX as you assumed.

    Reading some of the other answers as you suggested, and are now running without logging via UART, and we now see an idle current of 20-40uA running the asset_tracker_v2 on the Thingy 1.6.
    Which is good!

    However, we also have a couple of Thingys of version 1.4.0, and those show and idle current of ~200uA running the exact same FW.
    Is it expected that the v1.4 has so much higher idle current than the v1.6, and what might be the cause of that?

    Thanks!

    -Alf

Reply
  • Hi Stian, and thanks for good and informative hints!

    I've done some "research" against our sim provider, and we are now successfully running PSM (against Telenor).
    The 640ms spikes we saw earlier was due to eDRX as you assumed.

    Reading some of the other answers as you suggested, and are now running without logging via UART, and we now see an idle current of 20-40uA running the asset_tracker_v2 on the Thingy 1.6.
    Which is good!

    However, we also have a couple of Thingys of version 1.4.0, and those show and idle current of ~200uA running the exact same FW.
    Is it expected that the v1.4 has so much higher idle current than the v1.6, and what might be the cause of that?

    Thanks!

    -Alf

Children
Related