Fast notifications with nRF5340 and nRF Connect SDK

Board: nRF5340dk

SDK version: v2.1.0

My goal is to transmit 240 bytes of data every 5 ms using GATT notifications and 1 Mb PHY.

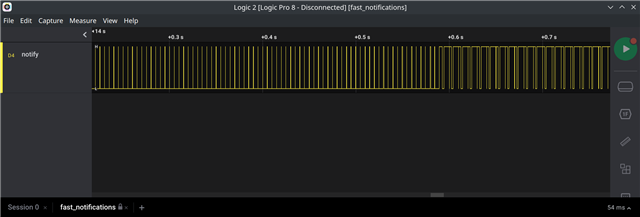
In the attached sample, I have my dev kit set up to notify on a characteristic every 5 ms. The connection interval is set to 10 ms, the MTU to 247 bytes, and the data length to 251 bytes. My thought is to fit 240 bytes into a single PDU, and send 2 notification packets per connection interval. I also toggle GPIO P0.04 before and after calling `bt_gatt_notify_cb`.

Looking at a logic analyzer trace of P0.04, I can see that while this setup initially works, eventually `bt_gatt_notify_cb` starts blocking for longer than expected. This happens around 14.5 seconds into the attached capture.

Wireshark capture also attached.

Why is `bt_gatt_notify_cb` blocking this long, and do you have any suggestions to improve the setup?

fast_notifications.zip

Parents
  • Hello,

    bt_gatt_notify_cb() is not a blocking call, so it should not be the reason why the P0.04 isn't toggling. 

    Are you sure that bt_gatt_notify_cb() is even called at 14.5 seconds into the trace? The trace doesn't show any notifications being sent around that time. In fact, it doesn't look like any notifications are sent at all in the connection starting at packet no. 7517 (12.89 seconds into the sniffer trace).

    Are you sure bt_gatt_notify_cb() is called at all? And if it is, what does it return? I assume it doesn't return 0, since no notifications are actually sent. 

    Best regards,

    Edvin

  • Hi Edvin,

    Sorry, I should have been a bit clearer on this. 

    • Please see L199-201 in main.c for the call to bt_gatt_notify_cb surrounded by P0.04 toggle.
    • My logic analyzer capture (.sal) and Wireshark capture (.pcapng) are unfortunately not synchronized because I did not have a way of starting them at the same time. When I mentioned 14.5 seconds, I was referring to the logic analyzer capture (see image below).
    • In the logic analyzer capture, the first notification is sent at 8.694 seconds. The first notification in the Wireshark capture is no. 9472 at 21.044 seconds.
    • The Wireshark capture includes the connection establishment (starting at no. 7518), MTU exchange, connection parameters, data length extension, etc.

    I should also mention that my central device is a nRF52840 dongle running the Nordic connectivity firmware, using the nRF Connect Desktop BLE app, and I can see the notifications appear in the app.

Reply
  • Hi Edvin,

    Sorry, I should have been a bit clearer on this. 

    • Please see L199-201 in main.c for the call to bt_gatt_notify_cb surrounded by P0.04 toggle.
    • My logic analyzer capture (.sal) and Wireshark capture (.pcapng) are unfortunately not synchronized because I did not have a way of starting them at the same time. When I mentioned 14.5 seconds, I was referring to the logic analyzer capture (see image below).
    • In the logic analyzer capture, the first notification is sent at 8.694 seconds. The first notification in the Wireshark capture is no. 9472 at 21.044 seconds.
    • The Wireshark capture includes the connection establishment (starting at no. 7518), MTU exchange, connection parameters, data length extension, etc.

    I should also mention that my central device is a nRF52840 dongle running the Nordic connectivity firmware, using the nRF Connect Desktop BLE app, and I can see the notifications appear in the app.

Children
  • So whereabout in the sniffer trace would you say that it starts to slow down?

    If you want to actually monitor whether or not the notifications are sent, you should check the return value from bt_gatt_notify_cb. This will tell you whether or not the packet is actually queued. 

    I guess the reason you are seeing these "slowing down" (they aren't really. You still have on average 1 interrupt every 5ms) is that you have this timer set to interrupt at the same rate as your connection interval (every other timer interrupt). Remember that every 10 ms the nRF needs to spin up the radio, and the softdevice controller takes over to handle the communication with the connected device. Due to clock accuracy (or inaccuracy), these connection events (the events that occur every connection interval) can drift a bit. I believe what you are seeing is that it drifted over to hit the timer interrupts, and in the middle of bt_gatt_notify_cb, the SoftDevice Controller (Bluetooth stack) takes control over the CPU to handle Bluetooth stuff, and then gives back the CPU to your application when it is done. At that point it will continue where it left off.

    Best regards,

    Edvin

Related