
My application is pretty consistently encountering a fatal error. The output from the SWD debug:
E: ***** MPU FAULT *****
E:   Instruction Access Violation
E: r0/a1:  0x20001df0  r1/a2:  0x200187b0  r2/a3:  0x00000000
E: r3/a4:  0x20001c90 r12/ip:  0x00000000 r14/lr:  0x0003fda5
E:  xpsr:  0x60000000
E: Faulting instruction address (r15/pc): 0x20001c90
E: >>> ZEPHYR FATAL ERROR 0: CPU exception on CPU 0
E: Current thread: 0x20001c90 (BT RX)
Following the advice of another post on Devzone, I set `CONFIG_RESET_ON_FATAL_ERROR=n` and used the Run and Debug extension in VSCode. Sure enough, it stopped on the error:
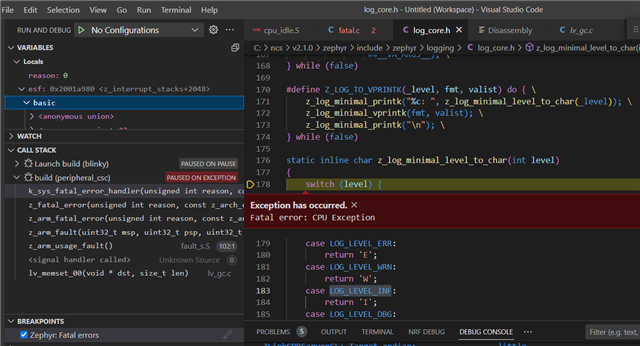
Here's where I'm struggling a bit. The call stack:
k_sys_fatal_error_handler(unsigned int reason, const z_arch_esf_t * esf) (c:\ncs\v2.1.0\zephyr\include\zephyr\logging\log_core.h:178)
z_fatal_error(unsigned int reason, const z_arch_esf_t * esf) (c:\ncs\v2.1.0\zephyr\kernel\fatal.c:131)
z_arm_fatal_error(unsigned int reason, const z_arch_esf_t * esf) (c:\ncs\v2.1.0\zephyr\arch\arm\core\aarch32\fatal.c:63)
z_arm_fault(uint32_t msp, uint32_t psp, uint32_t exc_return, _callee_saved_t * callee_regs) (c:\ncs\v2.1.0\zephyr\arch\arm\core\aarch32\cortex_m\fault.c:1070)
z_arm_usage_fault() (c:\ncs\v2.1.0\zephyr\arch\arm\core\aarch32\cortex_m\fault_s.S:102)
<signal handler called> (Unknown Source:0)
lv_memset_00(void * dst, size_t len) (c:\ncs\v2.1.0\modules\lib\gui\lvgl\src\misc\lv_gc.c:42)
Doesn't include any of my application code. Maybe because this is a thread spawned from the Kernel and nothing in my application?
Regardless, the error and location seem odd. It throws an "Instruction Access Violation` in a section of code that converts the log level to a character. I assume something is awry with my use of the `LOG_INF` macro in my application?
Edit:
A few other things have me confused:
- The thread is described as `(BT RX)`, what could cause a Bluetooth thread to have an instruction access violation on a log line?
- It says `Faulting Instruction `Faulting instruction address (r15/pc): 0x20001c90` - However that's the thread ID, not an instruction address? Looking in the dissasembly viewer I'm struggling to find that address, however, I also can't figure out how to search it

