segger embedded studio data breakpoints expressions nRF52833

Hello,

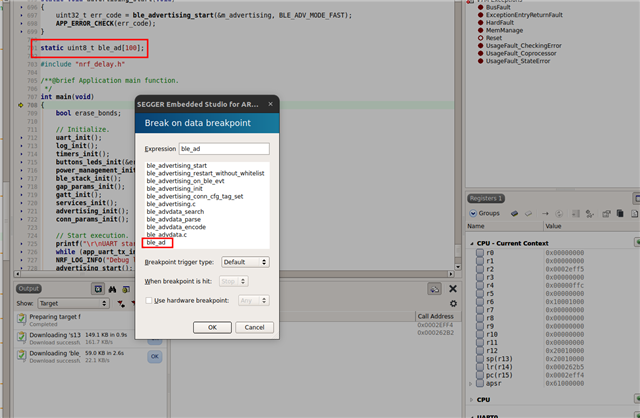
I am trying to set a data breakpoint expression on a global array or global variable  but I don't seem to be able to.

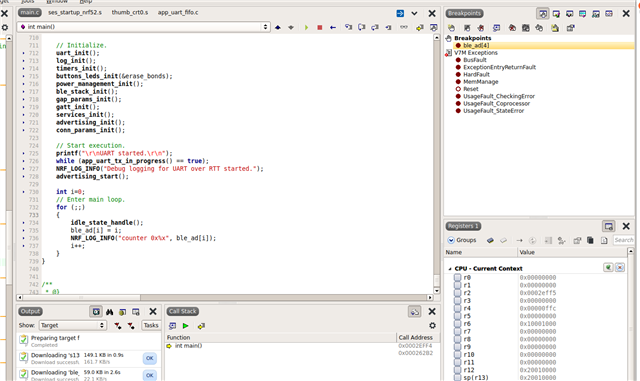
Each time I set a data breakpoint I get a '?' next to the breakpoint. See attached picture.

uint8_t ble_ad[HB_BLE_AD_BUFF_SIZE_MAX].

I am using segger Embedded Studio v5.60 and nRF52833 SoC.
Thank you.

Kind regards

Mohamed

Parents
  • Hello Mohamed,

    I created a global array named 'ble_ad' to try and reproduce this here, but it seemed to work for me. In your case, when you start typing your expression, does the variable get displayed up in the suggestion list as shown here:

    ?

    Kind regards,

    Vidar

  • Hi Vidar,

    Thank you for the quick response.

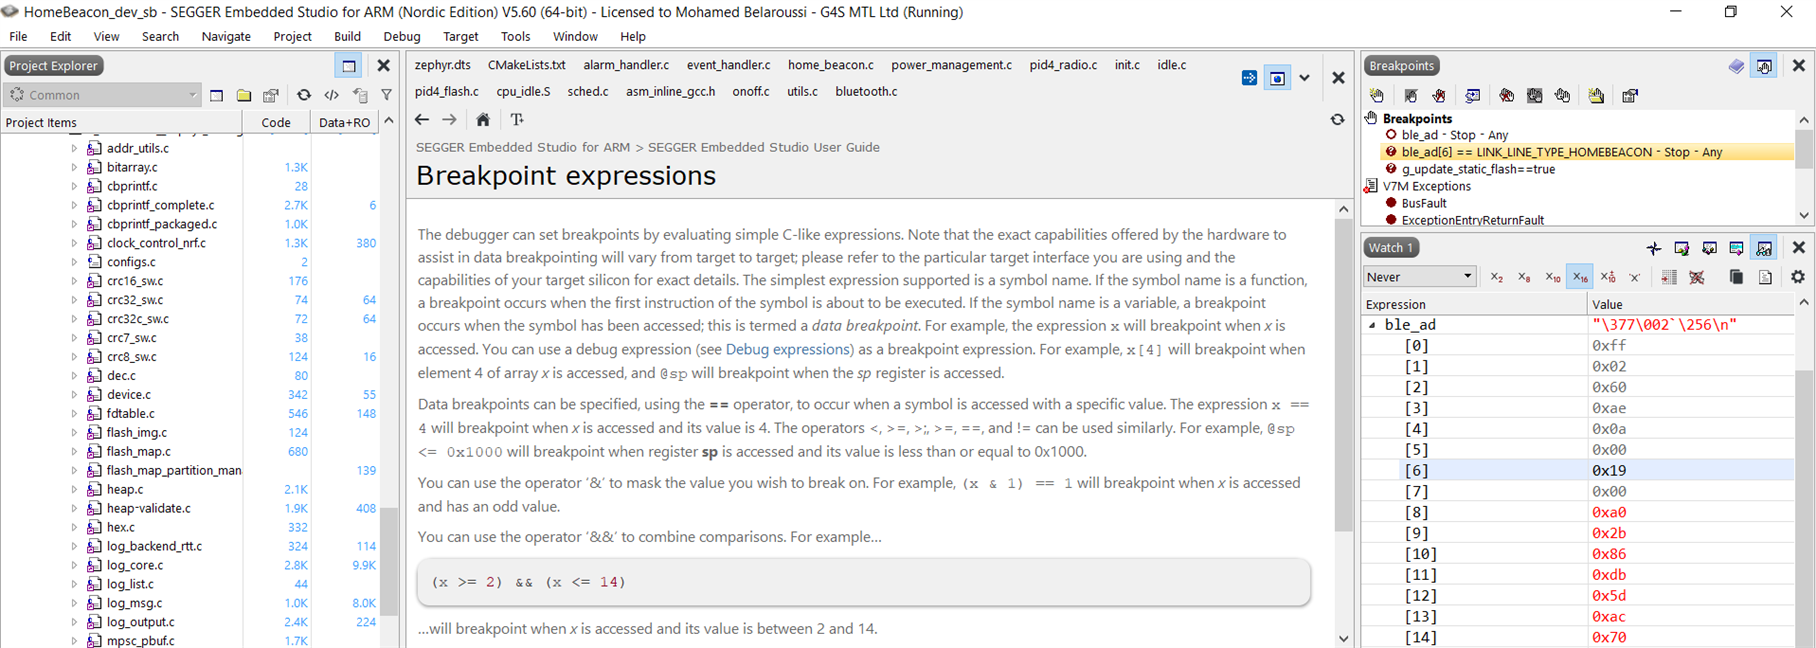
    What you did worked for me too. I ran into problems when I tried to use a data breakpoint expression applied to that variable. I suggest you edit your data breakpoint and try to use the expression I am using ble_ad[4] != 0 or any other C-like expression.

    After restarting SES IDE I can now set the data breakpoint expression without getting the '?' next to it. Very odd!

    However, the program is not breaking as expected. I checked this by setting a breakpoint at the line where ble_ad[6] is assigned the value 0x19 and it does execute this line an breaks.

    ble_ad[6] = LINK_LINE_TYPE_HOMEBEACON;

    Note, is an enum, defined ia header file as

    typedef enum eLinkLineType
    {
        LINK_LINE_TYPE_AGENCY = 0x00, /**< ? */
        LINK_LINE_TYPE_BUILDING_OWN = 0x01, /**< ? */

        ...
        LINK_LINE_TYPE_HOMEBEACON               = 0x19U,

        ...

    } link_PacketType_t;

    Thank you.

    Kind regards

    Mohamed

  • Good Morning Vidar,

    The stack area allocated to each thread can be found in the map file.

    I am attaching my map file please let me know where the stack area is.

    /cfs-file/__key/communityserver-discussions-components-files/4/2437.zephyr.map

    If you are unsure if it is enabled, you can check if CONFIG_MPU_STACK_GUARD=y

    It is already enabled in my .config file and this is the error I am getting. There is no mention of stack overflow violation but I am suspecting there is. So, what else could be causing this fault ?

    [00:19:08.163,787] \033[1;31m<err> os: ***** MPU FAULT *****\033[0m
    [00:19:08.163,787] \033[1;31m<err> os: Instruction Access Violation\033[0m
    [00:19:08.163,787] \033[1;31m<err> os: r0/a1: 0x00000000 r1/a2: 0x2000cfc0 r2/a3: 0x2000cfc0\033[0m
    [00:19:08.163,787] \033[1;31m<err> os: r3/a4: 0x200042ff r12/ip: 0x000000e2 r14/lr: 0x00010cff\033[0m
    [00:19:08.163,818] \033[1;31m<err> os: xpsr: 0x60000000\033[0m
    [00:19:08.163,818] \033[1;31m<err> os: Faulting instruction address (r15/pc): 0xeb699002\033[0m
    [00:19:08.163,818] \033[1;31m<err> os: >>> ZEPHYR FATAL ERROR 0: CPU exception on CPU 0\033[0m
    [00:19:08.163,818] \033[1;31m<err> os: Current thread: 0x20001f40 (sysworkq)\033[0m
    [00:19:09.107,147] \033[1;31m<err> os: Halting system\033[0m

    I have enabled the STACK_ANALYZER and I am attaching the stack analyzer logs from boot up to the "MPU FAULT" crash. Note, where you see the three dots (...)  is where I removed my application logs (LOG_DBG/INF/WRN/ERR) for readability.

    stack_analyzer_logs.txt

    Thank you

    Kind regards

    Mohamed

  • Hi Mohamed,

    The map file did not get uploaded. Anyway, the easiest way to try to rule out a stack overflow is often to try increasing the stack size, or have you tried that already? The sysworkq stack can be adjusted through the CONFIG_SYSTEM_WORKQUEUE_STACK_SIZE symbol.

    Kind regards,

    Vidar

  • Good Morning Vidar,

    The map file did not get uploaded.

    Here it is again.

    /cfs-file/__key/communityserver-discussions-components-files/4/1106.zephyr.map

    Anyway, the easiest way to try to rule out a stack overflow is often to try increasing the stack size, or have you tried that already?

    Did you have a look at the stack analyzer log file stack_analyzer_logs.txt I attached as a link in my previous message? there is nothing in the logs that suggest the stack is overflowing. Please have a look.

    Kind regards

    Mohamed

  • Hi Mohamed,

    The system workqueue stack is here:

    .noinit."WEST_TOPDIR/zephyr/kernel/system_work_q.c".0
    0x2000d760 0x820 zephyr/kernel/libkernel.a(system_work_q.c.obj)

    Did you have a look at the stack analyzer log file stack_analyzer_logs.txt I attached as a link in my previous message? there is nothing in the logs that suggest the stack is overflowing. Please have a

    I did, and I am not saying a believe it is a stack overflow. My suggestion was in response to your comment here: 

    There is no mention of stack overflow violation but I am suspecting there is.

    Kind regards,

    Vidar

  • Good Morning Vidar,

    The root cause of the MPU FAULT I was getting is an index that went astray and caused a buffer overflow. I would have thought the tools would have reported a BUFFER OVERFLOW error instead.

    So, although I managed to find the bug in my firmware I am still interested in your answer to my previous question,

    please help me find where the stack starts and whether it builds up or down.

    I would appreciate it if you could answer it or point me to a document that describes this.

    Thank you for your support over the last 10 days or so.

    Kind regards

    Mohamed

Reply
  • Good Morning Vidar,

    The root cause of the MPU FAULT I was getting is an index that went astray and caused a buffer overflow. I would have thought the tools would have reported a BUFFER OVERFLOW error instead.

    So, although I managed to find the bug in my firmware I am still interested in your answer to my previous question,

    please help me find where the stack starts and whether it builds up or down.

    I would appreciate it if you could answer it or point me to a document that describes this.

    Thank you for your support over the last 10 days or so.

    Kind regards

    Mohamed

Children
  • Hi Mohamed,

    It is good to hear that you were able to find out what triggered the fault in the end. 

    Learner said:
    I would have thought the tools would have reported a BUFFER OVERFLOW error instead.

    I am not sure how a fault handler could be made to detect buffer overruns. There are not any mechanisms to catch buffer overruns before memory corruption occurs either. The first step which I normally take in these situations is to have a look at the stack trace to see if I can determine where the exception was raised. The "Faulting instruction address" indicated that you may have had a corrupt function pointer. 

    Learner said:
    I would appreciate it if you could answer it or point me to a document that describes this.

    I am not aware of any documentation that covers this, but I showed you where you could find the stack areas in the .map file.

    Kind regards,

    Vidar

Related