spi_done event is delayed for unknown reason

hello Nordic

i am working with nrf52832 with ncs v1.9.2 with zephyr

i am using spim to read from a sensor

the spi xfer command is done via ppi with a timer ~20kHz

there is another timer set raise a gpiote, also via ppi, that tells the sensor start measure, also at the same speed.

the spi_done callback calles on a handler that pull the sensor gpiote back down, before it is raised back for the next conversion, and copy the data from the spi buffer.

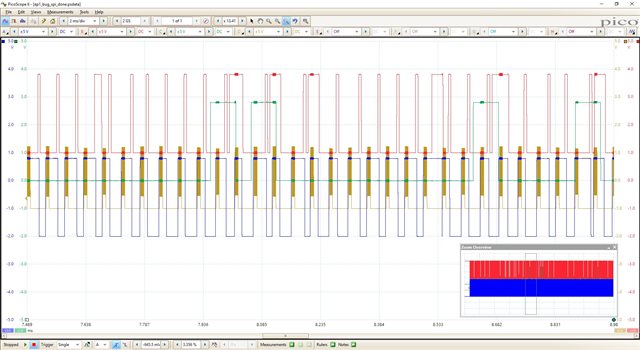
the problem i see with a picoscop is that the spi_done callback takes to much time to happen (more then 46microsec after an 8 bytes data read spi_xfer is called (spi_tx is 0 bytes) ) . this does not happen all the time (and not on all of the boards). this really mess things up as the handler may be called while next spi_xfer is in process and by that trying to copy the buffers that are being used by the spi, off course we also loos a sample because the sensor gpiote was not pulled down and back up because the ppi task to raise the gpiote did nothing for the already raised gpiote. 

this is a photo from the picoscop catch:

line color is brown for enter and exit the spi_done event handler

blue line is the spi clk and the

red line is the sensore start measure indication gpiote 

this is the event handler code:

void ads8866_spi_done_event_handler(void *ctx, uint8_t *rx_buff, int size)
{
    const struct device                   *ads8866_chain = (const struct device *)ctx;
    const struct ads8866_chain_dev_config *cfg = ads8866_chain->config;
    struct ads8866_chain_data             *drv_data = ads8866_chain->data;
    static int                             run_idx = 0;

    gpio_pin_set(gpio_dev_red, 25, 1);

    nrfx_gpiote_clr_task_trigger(cfg->conv_gpio.pin);

#ifdef CONFIG_ADS8866_CHAIN_ACC_CHANNELS_CONNECTED
    vib0_arrays[fill_sample_buff_idx][run_idx] = 0x8000 ^ (uint16_t)(((uint16_t)(rx_buff[0]) << 8) | rx_buff[1]);
    vib1_arrays[fill_sample_buff_idx][run_idx] = 0x8000 ^ (uint16_t)(((uint16_t)(rx_buff[2]) << 8) | rx_buff[3]);
    vib2_arrays[fill_sample_buff_idx][run_idx] = 0x8000 ^ (uint16_t)(((uint16_t)(rx_buff[4]) << 8) | rx_buff[5]);
    mag_arrays[fill_sample_buff_idx][run_idx] = 0x8000 ^ (uint16_t)(((uint16_t)(rx_buff[6]) << 8) | rx_buff[7]);
#else
    mag_arrays[fill_sample_buff_idx][run_idx] = 0x8000 ^ (uint16_t)(((uint16_t)rx_buff[0] << 8) | rx_buff[1]);
#endif

    run_idx++;
    if (SAMPLE_BUFF_SIZE <= run_idx)
    {
        run_idx = 0;
        if (true == app_buff_busy)
        {
            buff_overrun = true;
            return;
        }
        int temp_idx = app_used_buff_idx;
        app_used_buff_idx = fill_sample_buff_idx;
        fill_sample_buff_idx = temp_idx;
        app_buff_busy = true;
        k_sem_give(&drv_data->thread_sem);
    }
    gpio_pin_set(gpio_dev_red, 25, 0);
}

this is the dts part of the sensor with the spi 

&spi1 {
	status = "okay";
	sck-pin = <8>;    // gpio 0 pin 8
	mosi-pin = <0xFF>;
	miso-pin = <7>;    // gpio 0 pin 7
	compatible = "nordic,nrf-spim";
	ads8866_chain@0 {
		compatible = "ti,ads8866_chain";
		reg = <0>;
		chain_length = <4>;
		def_sample_freq = <20833>;
		conv_gpios = <&gpio0 6 GPIO_ACTIVE_HIGH>;
		str_gpios = <&gpio0 9 (GPIO_ACTIVE_HIGH | GPIO_PULL_DOWN)>;
		stbr_gpios = <&gpio0 10 (GPIO_ACTIVE_HIGH | GPIO_PULL_DOWN)>;
		label = "ADS8866_CHAIN";
		pm_mag_en_gpios = <&gpio0 22 GPIO_ACTIVE_HIGH>;
		pm_5v_en_gpios = <&gpio0 31 GPIO_ACTIVE_HIGH>;
		spi-max-frequency = <8000000>;
	};
};

&spi2 {
	status = "okay";
	sck-pin = <5>; // gpio 0 pin 5
	mosi-pin = <4>; // gpio 0 pin 4
	miso-pin = <2>; // gpio 0 pin 2
	compatible = "nordic,nrf-spim";
	cs-gpios = <&gpio0 3 (GPIO_PULL_UP | GPIO_ACTIVE_LOW)>;
	augu_flash_is25lp128: augu_flash_is25lp128@0 {
		compatible = "issi,augu_flash_is25lp128";
		reg = <0>;
		label = "AUGU_FLASH_IS25LP128";
		jedec_id = [ 9d 60 18  ];
		spi-max-frequency = <8000000>; //<133000000>;
		page_size = <256>;
		block_size = <65536>;
		size = <0x8000000>;
	};
};

any idea what can cause this delay ?

how can i check what is causing this delay, as it is supposed to be high priority irq  ?

(we don't know of anything else running at the same time but every 32 samples taken we write the data to external flash with another spi instance. the problem does not occur in corresponds to the time of every flash writing ?

hope to read from you soon 

best regards

Ziv

Parents
  • I've answered the related question:  use spi dma/easyDMA in a fifo manure, or cyclic queue . 

    As for DMA latencies, it depends on whether another DMA master is also trying to access the same RAM block as your SPIM peripheral. If you need to guarantee DMA access latency you will need to dedicate an entire RAM block to a given DMA master (f.ex. dedicate the RAM6 AHB slave to SPIM0 AHB master), see Memory spec. 

  • yes i have 2 spi masters, one for flash streaming the data (which is not called via ppi) and one for reading the samples from sensor (which is called via ppi). is it possible to define different priorities for each spi (for example spi0 and spi2) in the way they use DMA buffer ?  

    If you need to guarantee DMA access latency you will need to dedicate an entire RAM block to a given DMA master

    one block you mean give it 4k bytes of RAM ?  i can not take so much ram on a 64k RAM soc only for dma of 256bytes max page write, or 8 bytes of samples. can't i define some smaller DMA buffers for each SPI ?

    or maybe it is just a division of the RAM but the relevant section is still free for use.. in that case how do i decide the RAM to 2 sections (one for each dma salve of spi)?

    and in any case if DMA latency is my problem, the suggested approach of using DMA as fifo :

    I've answered the related question:  use spi dma/easyDMA in a fifo manure, or cyclic queue . 

    will not solve the problem of latency but maybe just hide it. am i right ?

  • ziv123 said:
    one block you mean give it 4k bytes of RAM ?  i can not take so much ram on a 64k RAM soc only for dma of 256bytes max page write, or 8 bytes of samples.

    Yes. As one block of ram is controlled by one AHB slave, and one AHB slave can only service one AHB master at a time. If one AHB slave is buisy serving an AHB master's R/W access to its RAM block, all other AHB masters requesting R/W access to the same RAM block will have to wait until the AHB slave has finished the current AHB masters RAM access (ie. until a DMA trasfer is complete, or the CPU has finished a R/W to this RAM block). 

    ziv123 said:
    or maybe it is just a division of the RAM but the relevant section is still free for use.. in that case how do i decide the RAM to 2 sections (one for each dma salve of spi)?

    Won't work, as both/all sections of a single RAM block are controlled by the same AHB slave. 

    If you can't allocate/dedicate entire RAM blocks to single AHB masters, you can spread out the access load across your RAM blocks. 

    If you know that one SPIM needs large/long accesses to RAM, like a data dump to ext flash, then you can put this SPIM's buffers in a RAM block that is not also used by the other SPIM that needs short and latency-constrained accesses to RAM. 

    The same is true for the CPU, put data with low RAM access loads in the same RAM blocks as the one's you've used for the two SPIM peripherals. That way you can still use the full 4KB RAM block, but you've lowered the propability that your SPIMs DMA transfers get blocked for a significant amount of time. 

    Note that this is a core feature of the AHB bus architechture. 

    ziv123 said:
    will not solve the problem of latency but maybe just hide it. am i right ?

    Solve and hide depends entirely on your latency/timing requirements. What exactly are your latency/timing requirements?  

  • Yes. As one block of ram is controlled by one AHB slave, and one AHB slave can only service one AHB master at a time. If one AHB slave is buisy serving an AHB master's R/W access to its RAM block, all other AHB masters requesting R/W access to the same RAM block will have to wait until the AHB slave has finished the current AHB masters RAM access (ie. until a DMA trasfer is complete, or the CPU has finished a R/W to this RAM block). 

    something does not make sense to me .. if you look at the pic from the picoscope, you can see that the clock of the sensor spi (in blue) runs just fine with no latency so there is no issue of writing to the buffers. you mean that i get late spi_done event because it waits for the read from buffers operation to be available (assuming the both buffers are on the same AHB, other wise it would not explain the spi_done delay if i understand correct) ? 

    another question is if the buffer i give the spi are the buffer it uses with DMA or does the ncs internally copy from and to its own buffer to the buffers i give ?

    Won't work, as both/all sections of a single RAM block are controlled by the same AHB slave. 

    If you can't allocate/dedicate entire RAM blocks to single AHB masters, you can spread out the access load across your RAM blocks. 

    i understand i can not divide a section, i meant how do i configure buffer to different AHB and does it require to define the RAM as divided or is it just how it is build anyway ?

  • ziv123 said:
    you mean that i get late spi_done event because it waits for the read from buffers operation to be available (assuming the both buffers are on the same AHB, other wise it would not explain the spi_done delay if i understand correct) ? 

    That is one of at least two sources that can block a peripheral's ISR from executing, in this example it is the SPIM peripheral itself who is blocked from accessing RAM and clocking out the data on the bus. After the RAM access block is is removed the SPIM can continue clocking out data. As a consequence its the firing of the END interrupt is delayed.
    You should be able to observe this by scoping the SPI bus in question and look for disruptions/delays of the bitstreams, but synched with the SPI clock signal. 

    The other source of a blocked ISR is one or more ISRs of equal or higher priority, currently executing or pending execution. I think this might be a more likely scenario, it has at least solutions that will make your application run more smoothly without having to manage statically allocated buffers sections. 


    ziv123 said:
    i understand i can not divide a section, i meant how do i configure buffer to different AHB and does it require to define the RAM as divided or is it just how it is build anyway ?

    It should be enough to define a section the size of the SPIM buffers and tell the linker to place it at an address somewhere inside a given RAM block. Do the same for any other peripheral with DMA, and maybe also for RAM intensive code execution. 
    The linker is then free to link to the rest of the RAM blocks as it chooses, as you've only allocated small parts of the RAM blocks. 


    I think we should investigate whether the ISR is blocked by another ISR before we start optimizing the AHB accesses, as I now realize that it is a more likely culprit. 

    I therefore propose that you start tracing the kernel if possible. I believe SEGGER's SystemView has an evaluation license, and it is a great tool when analyzing scheduling/execution conflicts as it presents detailed timing of when ISRs execute and for how long. See https://developer.nordicsemi.com/nRF_Connect_SDK/doc/latest/zephyr/services/tracing/index.html#segger-systemview-support 

  • in this example it is the SPIM peripheral itself who is blocked from accessing RAM and clocking out the data on the bus. After the RAM access block is is removed the SPIM can continue clocking out data
    You should be able to observe this by scoping the SPI bus in question and look for disruptions/delays of the bitstreams, but synched with the SPI clock signal. 

    maybe i don't understand but this is not what we see by scoping. as can be seen in the pic the spi clk is clocking ok, not clocking twice per sample but once, for 8 microsec as it should for transferring of 8 bytes, what is delayed is only the spi_done event which happens later in a changing timing, sometimes too late, even after or exactly at another spi clk start.

    the blue lines are the spi clock. what is delayed is the signal of spi_done callback (indicated by a gpio, which is the brown line, it goes up at beginning of callback and down at the end). why is it delayed if all data was allready saved after spi clock goes back down ?

    i did another test with gpios, seen as green line, also when spi_xfer is called for streaming to flash and pulled down at spi_done callback (which is a different callback, since one is normal spi and the sensor is xfer via ppi with a timer so there are different spi_done handlers). the results are strange .. beside having more done events then should on the sensor's spi (red lines up is spi done event start, down when callback finish), at one place it seems like spi_done event happens right at the same time or maybe a bit after spi clock starts .. this is not clear to me

    in any way it does not realy seems like the spi wait on each other and i don't see double the spi clock, it happens exactly as it should, its just the spi_done event that is delayed for reasons i don't yet understand.. any ideas ?

    I believe SEGGER's SystemView has an evaluation license, and it is a great tool when analyzing scheduling/execution conflicts as it presents detailed timing of when ISRs execute and for how long.

    i am working with vs code and vs code nrf connect extensions. is there a guide or compatible tool as to how to monitor all ISR and timing with vs code ? 

  • ziv123 said:
    what is delayed is the signal of spi_done callback (indicated by a gpio, which is the brown line, it goes up at beginning of callback and down at the end). why is it delayed if all data was allready saved after spi clock goes back down ?

    Yes, you are correct. I no longer believe the execution delay is caused by AHB access delays. 

    ziv123 said:
    the results are strange .. beside having more done events then should on the sensor's spi (red lines up is spi done event start, down when callback finish), at one place it seems like spi_done event happens right at the same time or maybe a bit after spi clock starts .. this is not clear to me

    I count equal numbers of pulses for the red, brown, and blue gpios, at least for the first 31 visible sensor data transfers. I do however see that there is a significant timing issue in servicing the SPI interrupts. 

    To solve this issue I propose this solution:

    • That you use the EasyDMA List feature i mentioned earlier, with two Lists used as ping-pong buffers. With a List size of 1024bytes you will get an ISR every (1000ms/20kHz)*(1024B/8B)) = 6.4ms. 

    • That you disable all interrupts for SPIM1, use a TIMER to count SPIM1's END events and trigger a COMPARE event after 1024B/8B=128 SPIM END events. The TIMER's ISR will then indicate a full EasyDMA List after the COMPARE event. 
      Enable the COMPARE0_CLEAR shortcut in SHORTS to reset the TIMER's counter value.
    • In the TIMER ISR you add the current EasyDMA List to a FIFO with a call to k_fifo_put(&sensor_fifo, &list_x) and return immidiately after. 

    • Set up a separate sensor data processing thread, with an infinite loop where you access the EasyDMA List with a call to k_fifo_get(&sensor_fifo, K_FOREVER), and process it however you want to. See Reading from a FIFO for a code example.

      This thread will be blocked from executing if k_fifo_get() is called and the sensor_fifo queue is empty. As soon as any item is added to the sensor_fifo queue (from anywhere) the thread will be scheduled to resume.

      Now you can process the sensor data in this thread and schedule the SPI flash write with minimal impact to the system.

    There will still be an issue of the timing requirement of updating the address of the next/other EasyDMA List to the SPIM's RXD.PTR register. If RXD.PTR is not updated by the time the next TASKS_START is triggered via PPI, then the SPIM will overflow the current List by 1xRXD.MAXCNT of data, corrupting any memory there, and your next List will be missing the first 1xRXD.MAXCNT of data.
    This is exactly the same issue as before, but now we have bought us 6.4ms of time, and we have significantly reduced the SPIM ISR overhead. 

    Now to solve the issue of updating RXD.PTR i propose three solutions:

    1. Update RXD.PTR in the TIMER ISR, before calling k_fifo_put(&sensor_fifo, &list_x). 
      Since the SPI flash write is guaranteed to occur after the TIMER ISR has returned, the SPI flash write done event and ISR will not collide with and delay the TIMER ISR unless the sensor data processing thread and the following SPI flash write takes close to 6.4ms to execute. 

    2. Essentially similar to above. RXD.PTR is double-buffered and can be updated immidiately after the last EVENTS_STARTED has fired. This can buy you 8B*8b = 64 SPI CLK amount of time.

      Use the TIMER to count both of SPIM1's EVENTS_STARTED and EVENTS_END. Have COMPARE0 trigger after the last EVENTS_STARTED has fired, and COMPARE1 to trigger after the last EVENTS_END has fired. This will be at (2*1024B/8B) -1) and (2*1024B/8B) respectively. 

      In this case when COMPARE0 fires you update RXD.PTR in the TIMER ISR and immidiately return.


    3. In the previous two solutions RXD.PTR has been updated synchroniously after the current List is full. Here I propose to an aynchronous approach where you update RXD.PTR at an arbitrary point before the current List is full.  
      If RXD.PTR is updated before the current List is full (TIMER COMPARE event) the next List will be used the next time SPIM1's TASKS_START is triggered. 

      The TIMER COMPARE event now indicates that the current List has been filled with an amount of data, and if you have guaranteed that the RXD.PTR has been updated before the TIMER COMPARE event triggered, that the current List is safe to add to the sensor_fifo queue. 

      Since the amount of data in the current List is unknown, but guaranteed to be less than sizeof(List), you can use data padding to locate the end of the SPIM data. ie. write the Lists to a known value, f.ex. 0xFF or 0x00, given that there exist such a value that the sensors cannot output. 

    I believe the 3. solution to the issue of updating RXD.PTR in a timely manner has the best chance of success as your timing requirements can be relaxed by orders of magnitudes compared to solutions 1. and 2. 

    The requirements to implement solution 3. is:

    • An available TIMER.
    • The ability to pad the EasyDMA Lists with a known value.
    • The ability to update RXD.PTR at some point in time between the start and end of the List currently being written to by SPIM.
    • Enough available RAM dedicated to EasyDMA Lists to ensure that the requirement in the bullet-point above is met. 

    If you can implement the 3. solution you will be able to meet your real-time requirements while simultaneously reducing the scheduling load of your system significantly. 

    PS:
    There's no trace visualization tools built-in to the nRF Connect extension for VS Code yet. 

Reply
  • ziv123 said:
    what is delayed is the signal of spi_done callback (indicated by a gpio, which is the brown line, it goes up at beginning of callback and down at the end). why is it delayed if all data was allready saved after spi clock goes back down ?

    Yes, you are correct. I no longer believe the execution delay is caused by AHB access delays. 

    ziv123 said:
    the results are strange .. beside having more done events then should on the sensor's spi (red lines up is spi done event start, down when callback finish), at one place it seems like spi_done event happens right at the same time or maybe a bit after spi clock starts .. this is not clear to me

    I count equal numbers of pulses for the red, brown, and blue gpios, at least for the first 31 visible sensor data transfers. I do however see that there is a significant timing issue in servicing the SPI interrupts. 

    To solve this issue I propose this solution:

    • That you use the EasyDMA List feature i mentioned earlier, with two Lists used as ping-pong buffers. With a List size of 1024bytes you will get an ISR every (1000ms/20kHz)*(1024B/8B)) = 6.4ms. 

    • That you disable all interrupts for SPIM1, use a TIMER to count SPIM1's END events and trigger a COMPARE event after 1024B/8B=128 SPIM END events. The TIMER's ISR will then indicate a full EasyDMA List after the COMPARE event. 
      Enable the COMPARE0_CLEAR shortcut in SHORTS to reset the TIMER's counter value.
    • In the TIMER ISR you add the current EasyDMA List to a FIFO with a call to k_fifo_put(&sensor_fifo, &list_x) and return immidiately after. 

    • Set up a separate sensor data processing thread, with an infinite loop where you access the EasyDMA List with a call to k_fifo_get(&sensor_fifo, K_FOREVER), and process it however you want to. See Reading from a FIFO for a code example.

      This thread will be blocked from executing if k_fifo_get() is called and the sensor_fifo queue is empty. As soon as any item is added to the sensor_fifo queue (from anywhere) the thread will be scheduled to resume.

      Now you can process the sensor data in this thread and schedule the SPI flash write with minimal impact to the system.

    There will still be an issue of the timing requirement of updating the address of the next/other EasyDMA List to the SPIM's RXD.PTR register. If RXD.PTR is not updated by the time the next TASKS_START is triggered via PPI, then the SPIM will overflow the current List by 1xRXD.MAXCNT of data, corrupting any memory there, and your next List will be missing the first 1xRXD.MAXCNT of data.
    This is exactly the same issue as before, but now we have bought us 6.4ms of time, and we have significantly reduced the SPIM ISR overhead. 

    Now to solve the issue of updating RXD.PTR i propose three solutions:

    1. Update RXD.PTR in the TIMER ISR, before calling k_fifo_put(&sensor_fifo, &list_x). 
      Since the SPI flash write is guaranteed to occur after the TIMER ISR has returned, the SPI flash write done event and ISR will not collide with and delay the TIMER ISR unless the sensor data processing thread and the following SPI flash write takes close to 6.4ms to execute. 

    2. Essentially similar to above. RXD.PTR is double-buffered and can be updated immidiately after the last EVENTS_STARTED has fired. This can buy you 8B*8b = 64 SPI CLK amount of time.

      Use the TIMER to count both of SPIM1's EVENTS_STARTED and EVENTS_END. Have COMPARE0 trigger after the last EVENTS_STARTED has fired, and COMPARE1 to trigger after the last EVENTS_END has fired. This will be at (2*1024B/8B) -1) and (2*1024B/8B) respectively. 

      In this case when COMPARE0 fires you update RXD.PTR in the TIMER ISR and immidiately return.


    3. In the previous two solutions RXD.PTR has been updated synchroniously after the current List is full. Here I propose to an aynchronous approach where you update RXD.PTR at an arbitrary point before the current List is full.  
      If RXD.PTR is updated before the current List is full (TIMER COMPARE event) the next List will be used the next time SPIM1's TASKS_START is triggered. 

      The TIMER COMPARE event now indicates that the current List has been filled with an amount of data, and if you have guaranteed that the RXD.PTR has been updated before the TIMER COMPARE event triggered, that the current List is safe to add to the sensor_fifo queue. 

      Since the amount of data in the current List is unknown, but guaranteed to be less than sizeof(List), you can use data padding to locate the end of the SPIM data. ie. write the Lists to a known value, f.ex. 0xFF or 0x00, given that there exist such a value that the sensors cannot output. 

    I believe the 3. solution to the issue of updating RXD.PTR in a timely manner has the best chance of success as your timing requirements can be relaxed by orders of magnitudes compared to solutions 1. and 2. 

    The requirements to implement solution 3. is:

    • An available TIMER.
    • The ability to pad the EasyDMA Lists with a known value.
    • The ability to update RXD.PTR at some point in time between the start and end of the List currently being written to by SPIM.
    • Enough available RAM dedicated to EasyDMA Lists to ensure that the requirement in the bullet-point above is met. 

    If you can implement the 3. solution you will be able to meet your real-time requirements while simultaneously reducing the scheduling load of your system significantly. 

    PS:
    There's no trace visualization tools built-in to the nRF Connect extension for VS Code yet. 

Children
  • hi Haakonsh

    i get your direction, though looking at the picoscop again i am thinking maybe my problem is not a delay but something else 

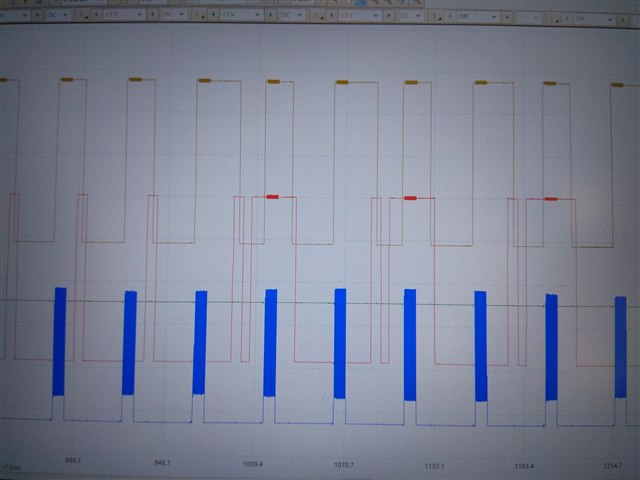
    i wanted to added the picoscop6 files (but .psdata files are not allowed)so i put the phtots here .. what i actually see is that i get 2 spi_done callbacks instead of just one after an spi xfer is done.

    the blue lines represent spi_clock the red line raise represent spi_done event

    what do you think ? am i getting this wrong or may be there is some other explanation to that ? 

    if not, then what can cause the extra spi_done event ? 

    also, i tried to put the event handler of the spi_done be called by a timer and i tryied to disable all spi callback by adding 'NRFX_SPIM_FLAG_NO_XFER_EVT_HANDLER'

    but i still see from time to time that the gpio i put on the spi_handler happens, any idea why is that ?

    hope to read from you soon 

    best regards

    Ziv

  • ziv123 said:
    i wanted to added the picoscop6 files (but .psdata files are not allowed)

    Put files in a compressed folder, it ususally works for me. 

    ziv123 said:

    i get your direction, though looking at the picoscop again i am thinking maybe my problem is not a delay but something else 

    i wanted to added the picoscop6 files (but .psdata files are not allowed)so i put the phtots here .. what i actually see is that i get 2 spi_done callbacks instead of just one after an spi xfer is done.

    You're still getting the correct number of spi_done callbacks, but they appear to be way out of sync with SPI CLK, and their delays are correlated to the pulse-width of the yellow/brown signal. 
    What is the yellow/brown signal? 

    I suggest you overlay the SPIM peripheral END event directly by connecting it to a GPIOTE channel via PPI. That way you can measure the actual delay from when the END event fires to when your spi_done callback sets your GPIO.

    I would also like to see the previous scope, but from the first spi_done event after boot. That way we can observe whether your spi_done callback is delayed by more than one sensor sample period or not. 

Related