Does the ppk2 average the high sampling rate when using its low sampling rate?

Hi,

There is another thread with this exact question, but I don't understand the answer, and the thread is locked.

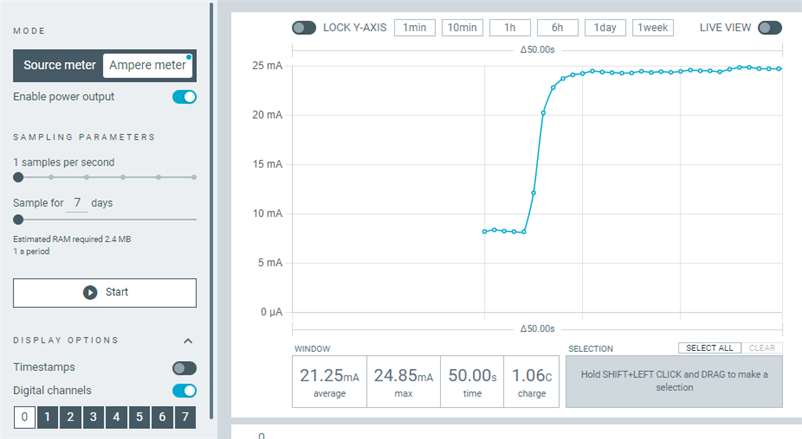
This is the PPK2 measuring at 1 sample per second.

I start up a high-consumption device, which starts basically instantly, and the graph shows multiple seconds of gradual increase.  You can see the individual data points, which should correspond to 1 data point per second.
Here is another shot, sampling at 10 samples per second, of the same event.  Now I can see 6 samples leading to peak consumption, which corresponds to 600ms, far less duration than the 1-sample-per-second graph above, for the same event.
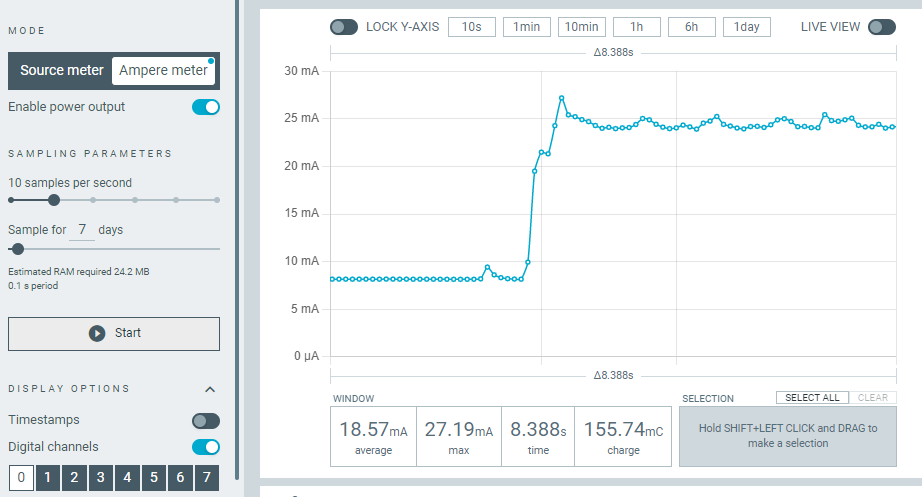
This makes me believe the PPK is doing some rolling window averaging of values.  Is that how it works?

I know the device is capable of doing 100,000 samples/sec.  Does it do that all the time regardless of configuration, and feed that data into a rolling average?

How wide is the window of the rolling average?  Does it depend on the configuration settings?

And is that window centered on the data point to be drawn?  For example, in the first graph, it took multiple seconds of wall clock time for the graph to finally reach its peak value, despite the actual electronics changing consumption nearly instantly.  Makes me think there is a multi-second-wide window which is waiting for future data to arrive to calculate "now's" value.

Please if you can explain how this works.  Please let me know if my comments and terminology don't make sense I can try to be clearer. 

If there is a technical document describing the implementation that would be helpful too of course.

Thanks.
Parents
  • Hi

    So I got a hold of a person involved in writing the averaging algorithm, and here's what they have to say (paraphrasing):

    It is a simple rolling average that does not use buffers. 

    We have tested the averaging extensively so that it provides the same average value below the chart for a given selected window for the same datasets within a reasonable error margin.

    Do you think you can upload the same data set under different sampling conditions in the same time window and provide some calculations so we can be sure that we're seeing this on the same measurements?

    Best regards,

    Simon

  • Hi, thanks for the update!

    Do you think you can upload the same data set under different sampling conditions in the same time window and provide some calculations so we can be sure that we're seeing this on the same measurements?

    I'm not sure what you mean by that.

    In the images above, I showed two different sampling rates for the event of a device turning on.  My questions were around how the "average" values were calculated given the timeframes and sampling rates stated.

    What are you looking for?

    Thanks.

    Doug

  • Sorry, I guess that wasn't very clear. Can you provide the .ppk files (they can be exported from the app and uploaded in a .zip file to DevZone) of your application starting up at I.E. 1 sample/sec and 1000 samples per sec. for example where it should be easy to see the difference in timing. 

    Best regards,

    Simon

    UPDATE: More exactly what our developer wants you to do. Repeat the experiment with both sampling frequencies and also at higher or even full frequency and use the same window selected (also use SHIFT+LEFT CLICK and DRAG as shown in the UI) in order to correlate the different measurements might help us decide if this is in fact a bug or just a fluke.

Reply
  • Sorry, I guess that wasn't very clear. Can you provide the .ppk files (they can be exported from the app and uploaded in a .zip file to DevZone) of your application starting up at I.E. 1 sample/sec and 1000 samples per sec. for example where it should be easy to see the difference in timing. 

    Best regards,

    Simon

    UPDATE: More exactly what our developer wants you to do. Repeat the experiment with both sampling frequencies and also at higher or even full frequency and use the same window selected (also use SHIFT+LEFT CLICK and DRAG as shown in the UI) in order to correlate the different measurements might help us decide if this is in fact a bug or just a fluke.

Children
No Data
Related